
ObzenFlow Studio
Topology, live metrics, middleware state, and contract evidence on one canvas.
When something goes wrong in a running flow, the answer is usually scattered across dashboards, logs, and tribal knowledge. ObzenFlow Studio puts the whole operational surface in one place.
See it
The running flow, not a stale diagram.
Topology, runtime stage types, composite membership, cycles, and dense graph layouts are rendered from the live server.
Diagnose it
Metrics, middleware, and backpressure on the canvas.
Flow-level and stage-level signals show where the system is slowing down or failing.
Prove it
Contract status and edge evidence where events move.
Passing, pending, overridden, and violated delivery contracts are visible on the topology.
Operate it
Start, stop, drain, and inspect flow state.
Lifecycle controls follow the real server state so the UI reflects what is actually running.
See it
See the running topology, not a stale diagram.
What does your flow look like right now?
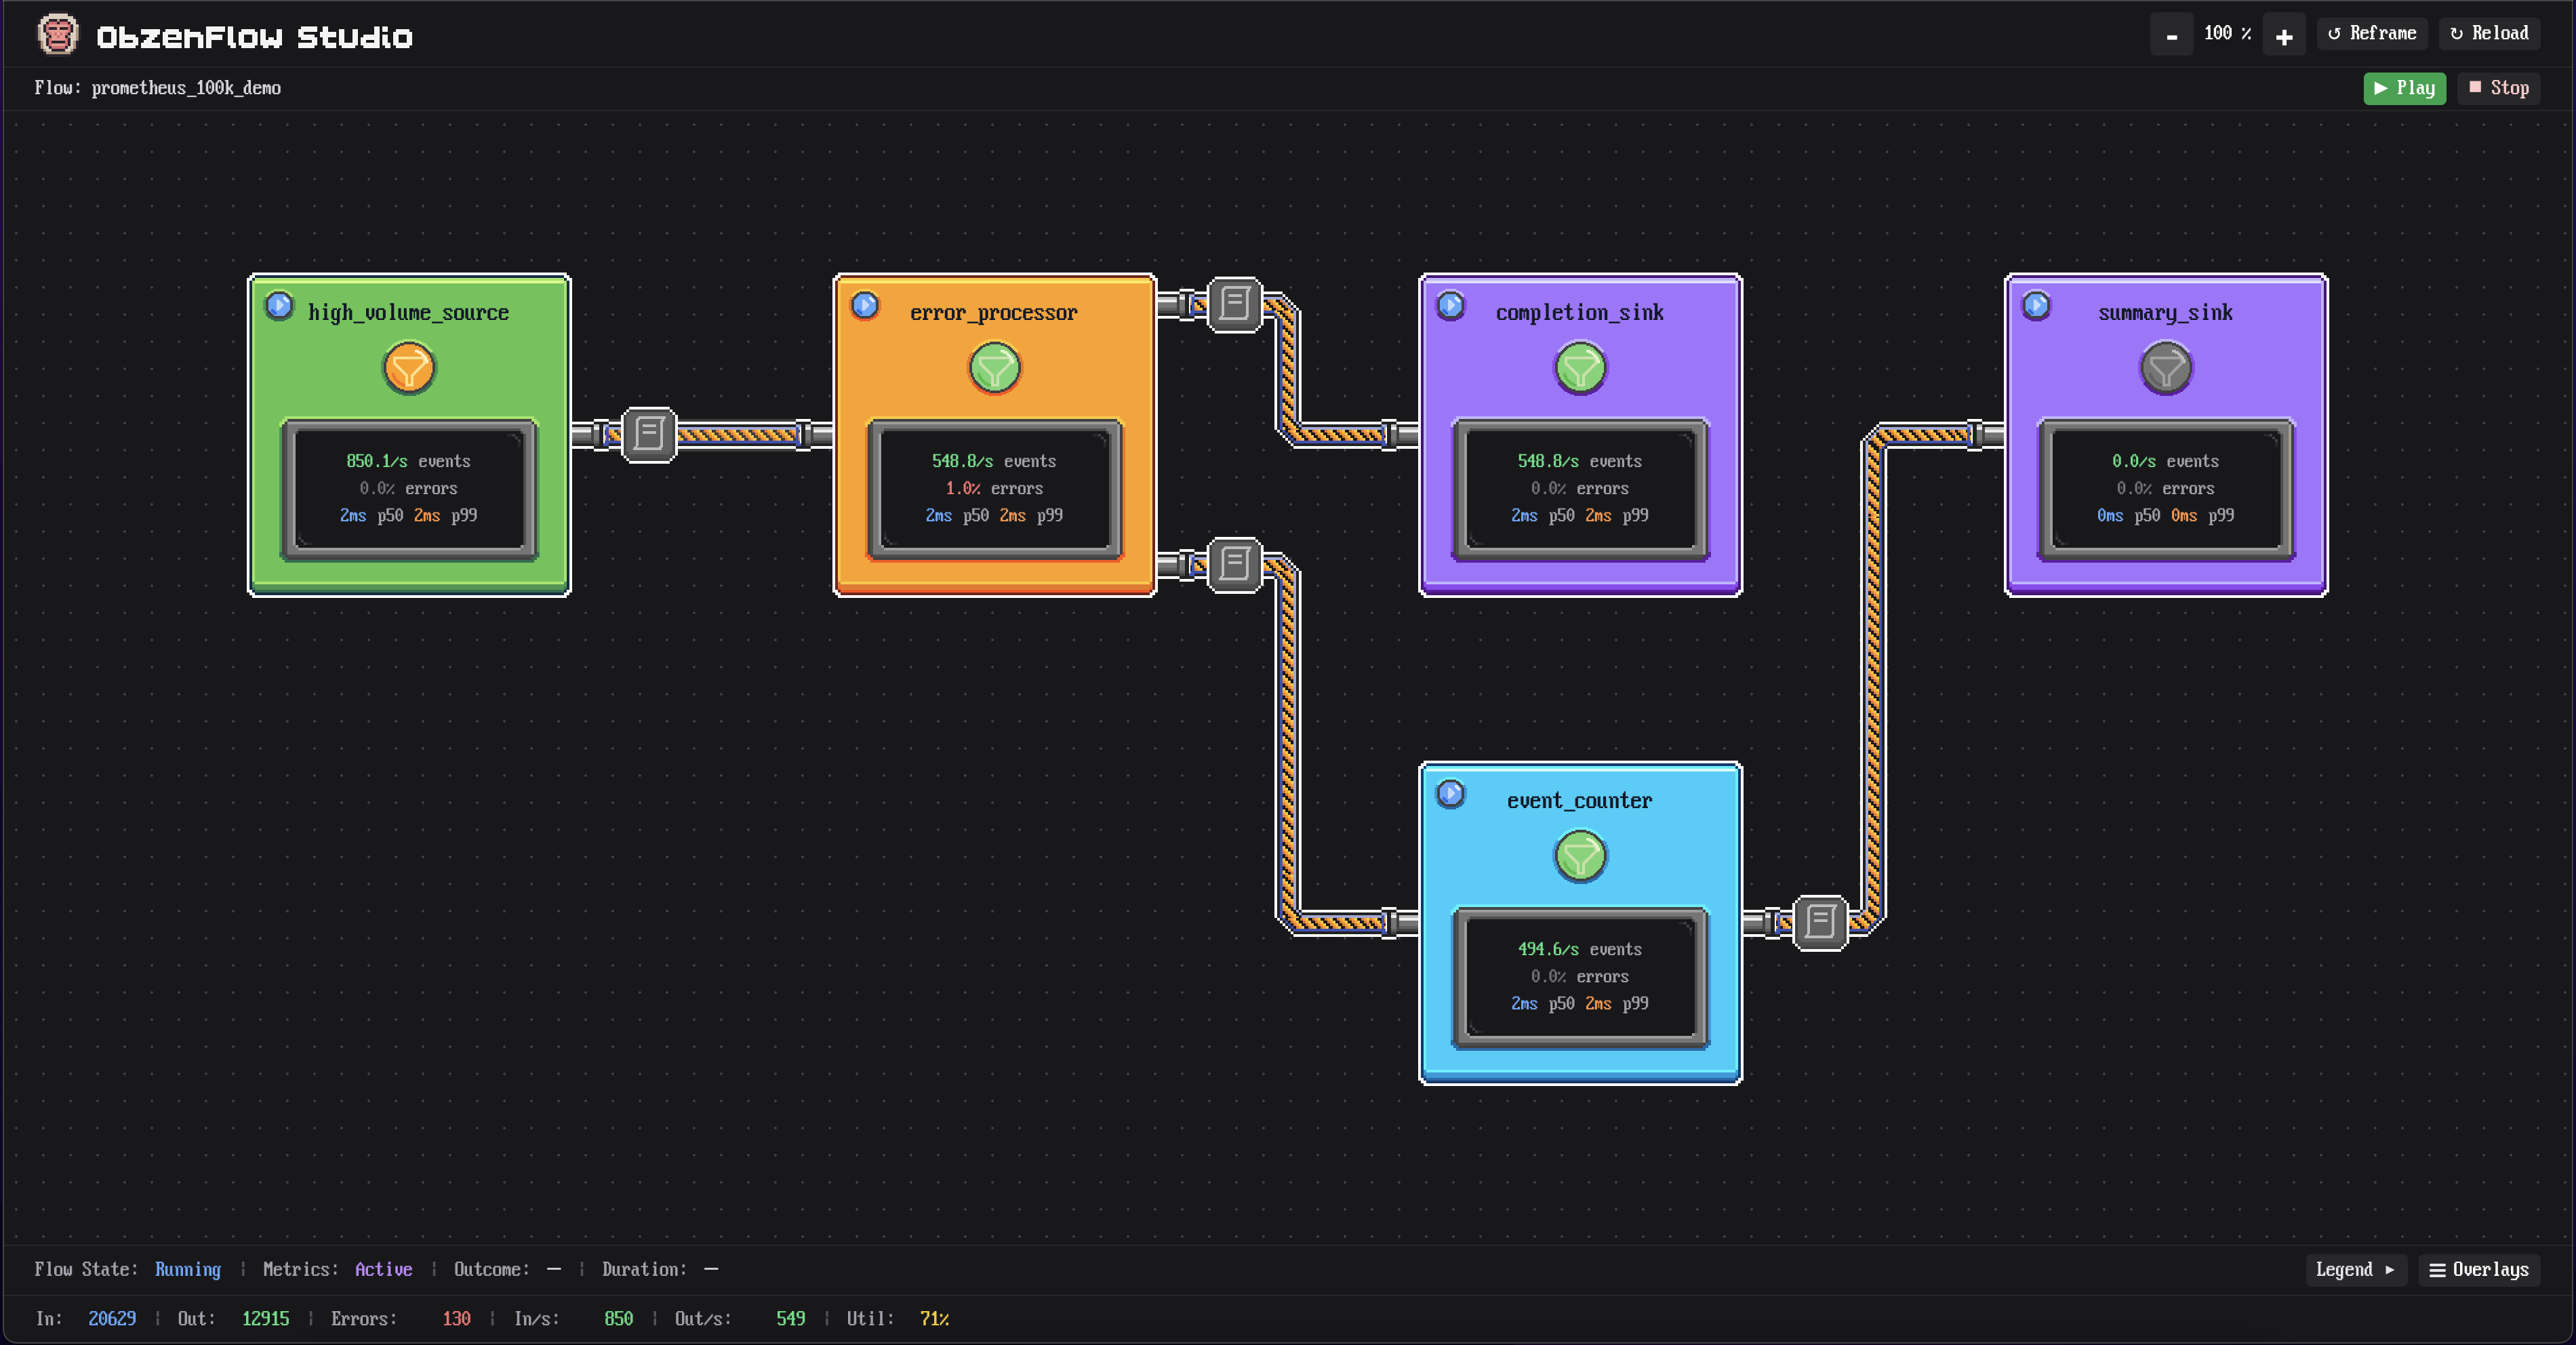
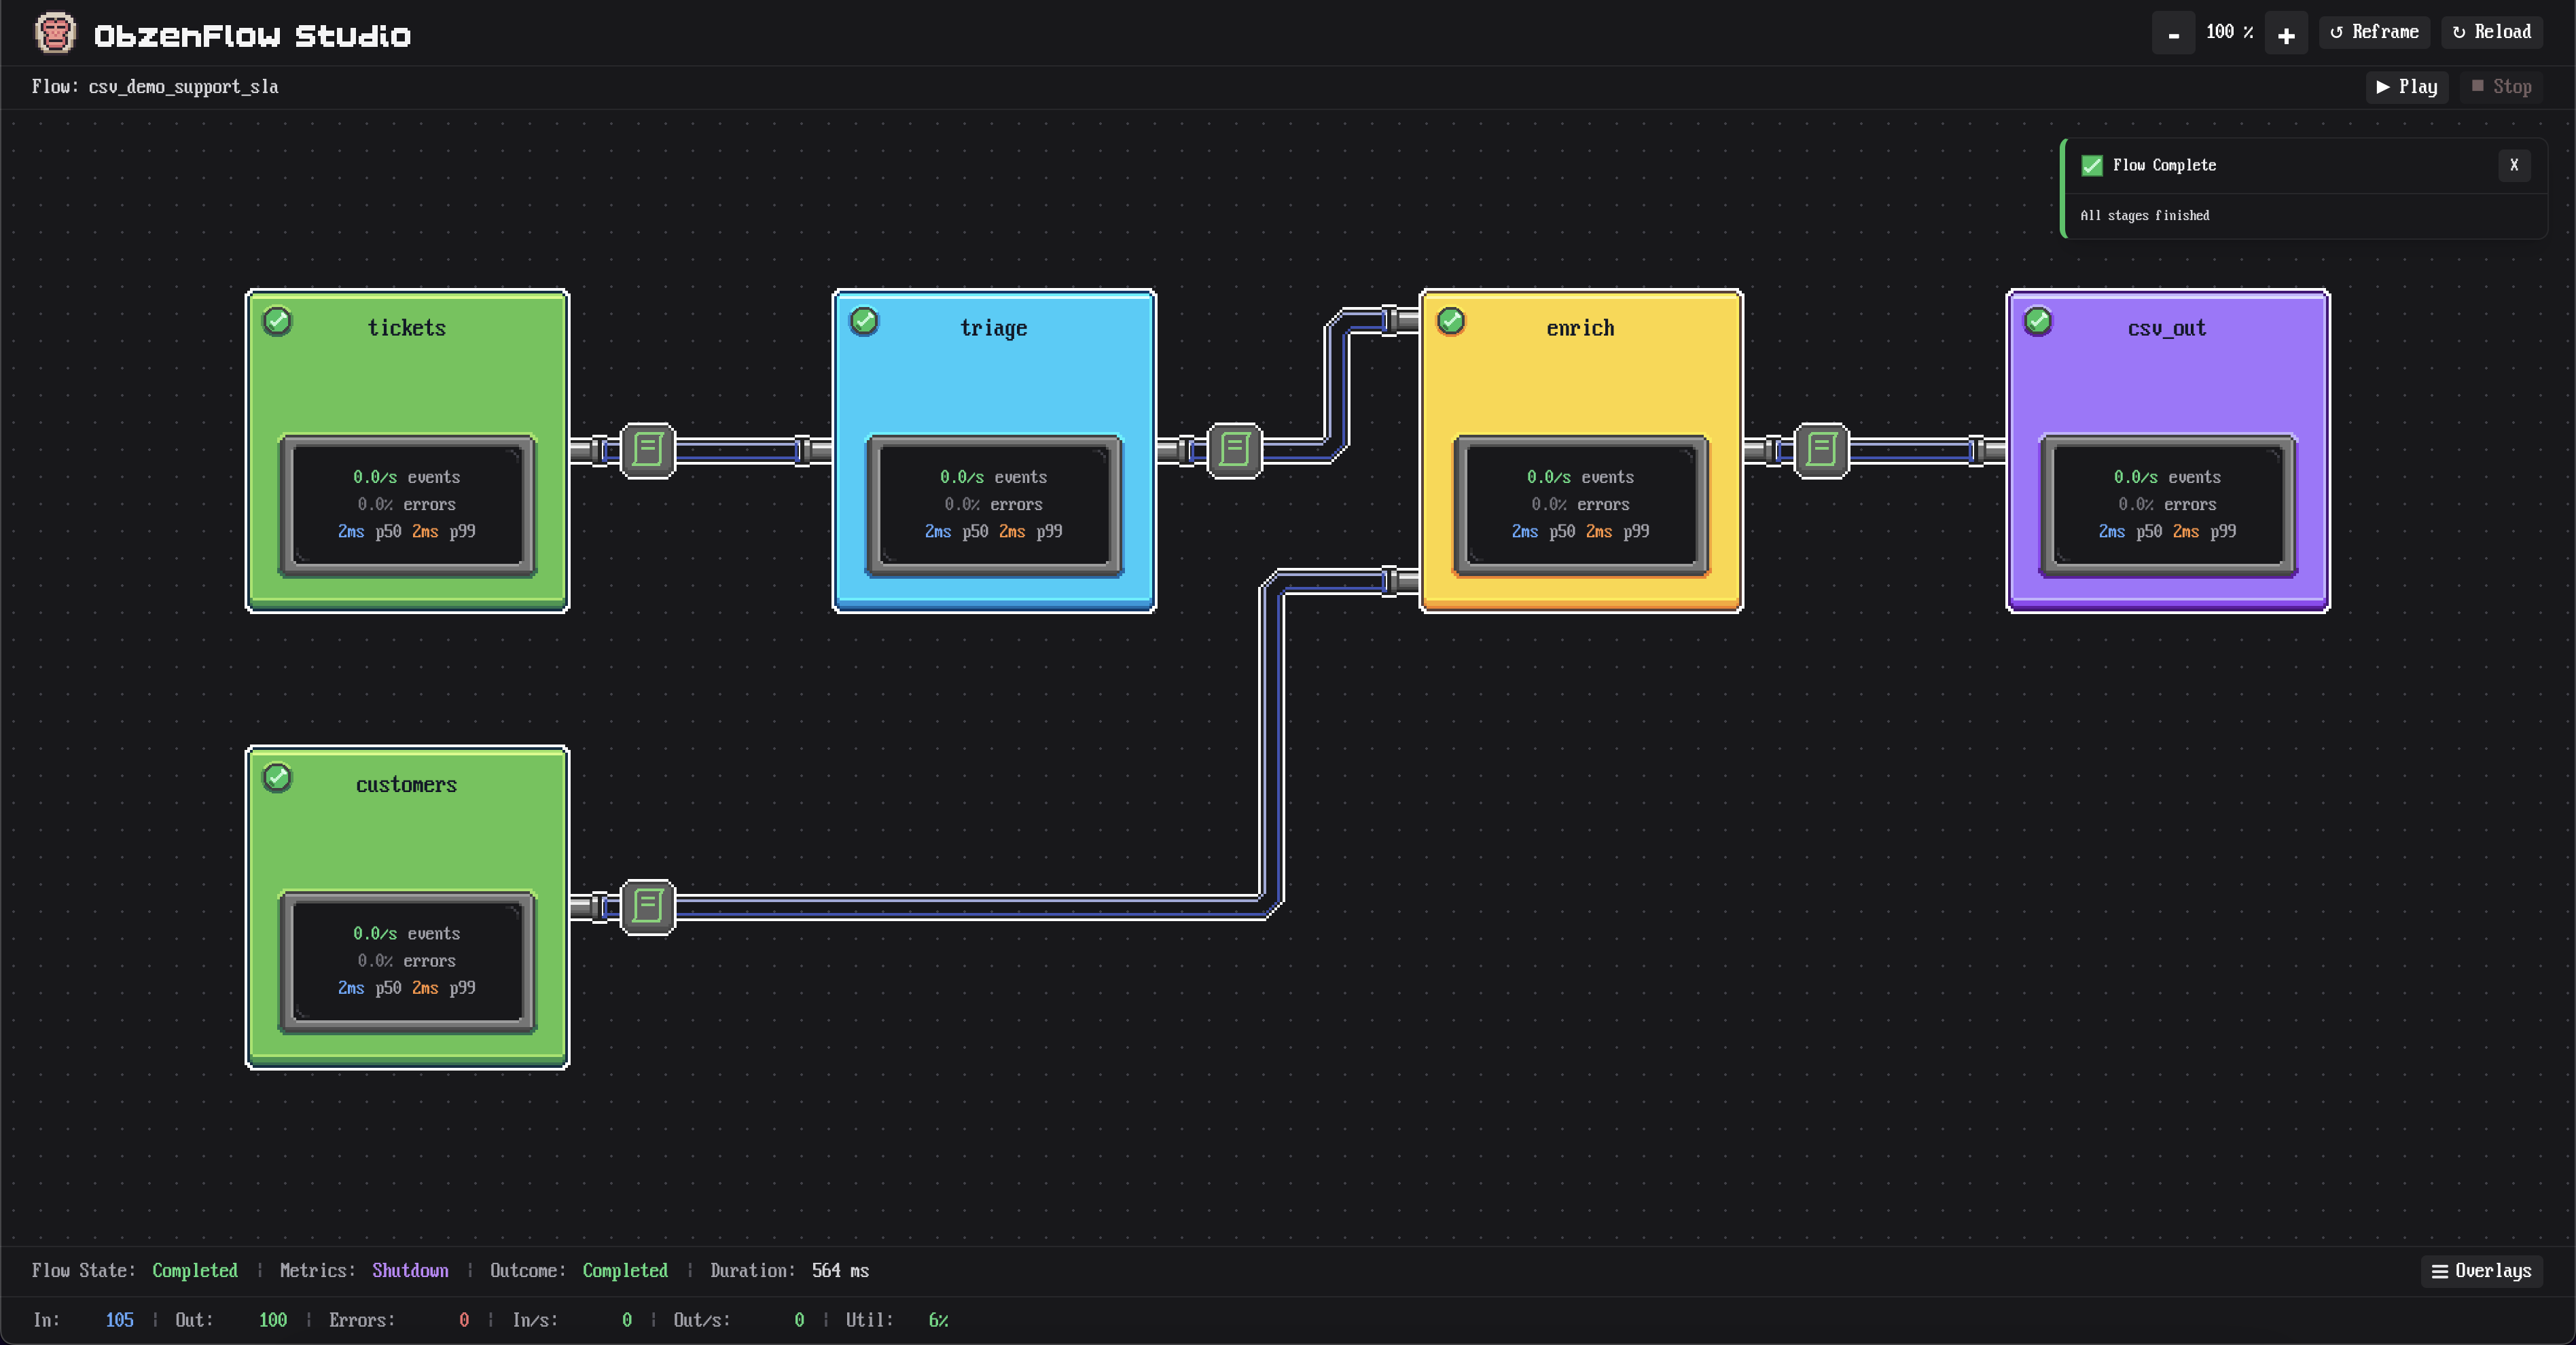
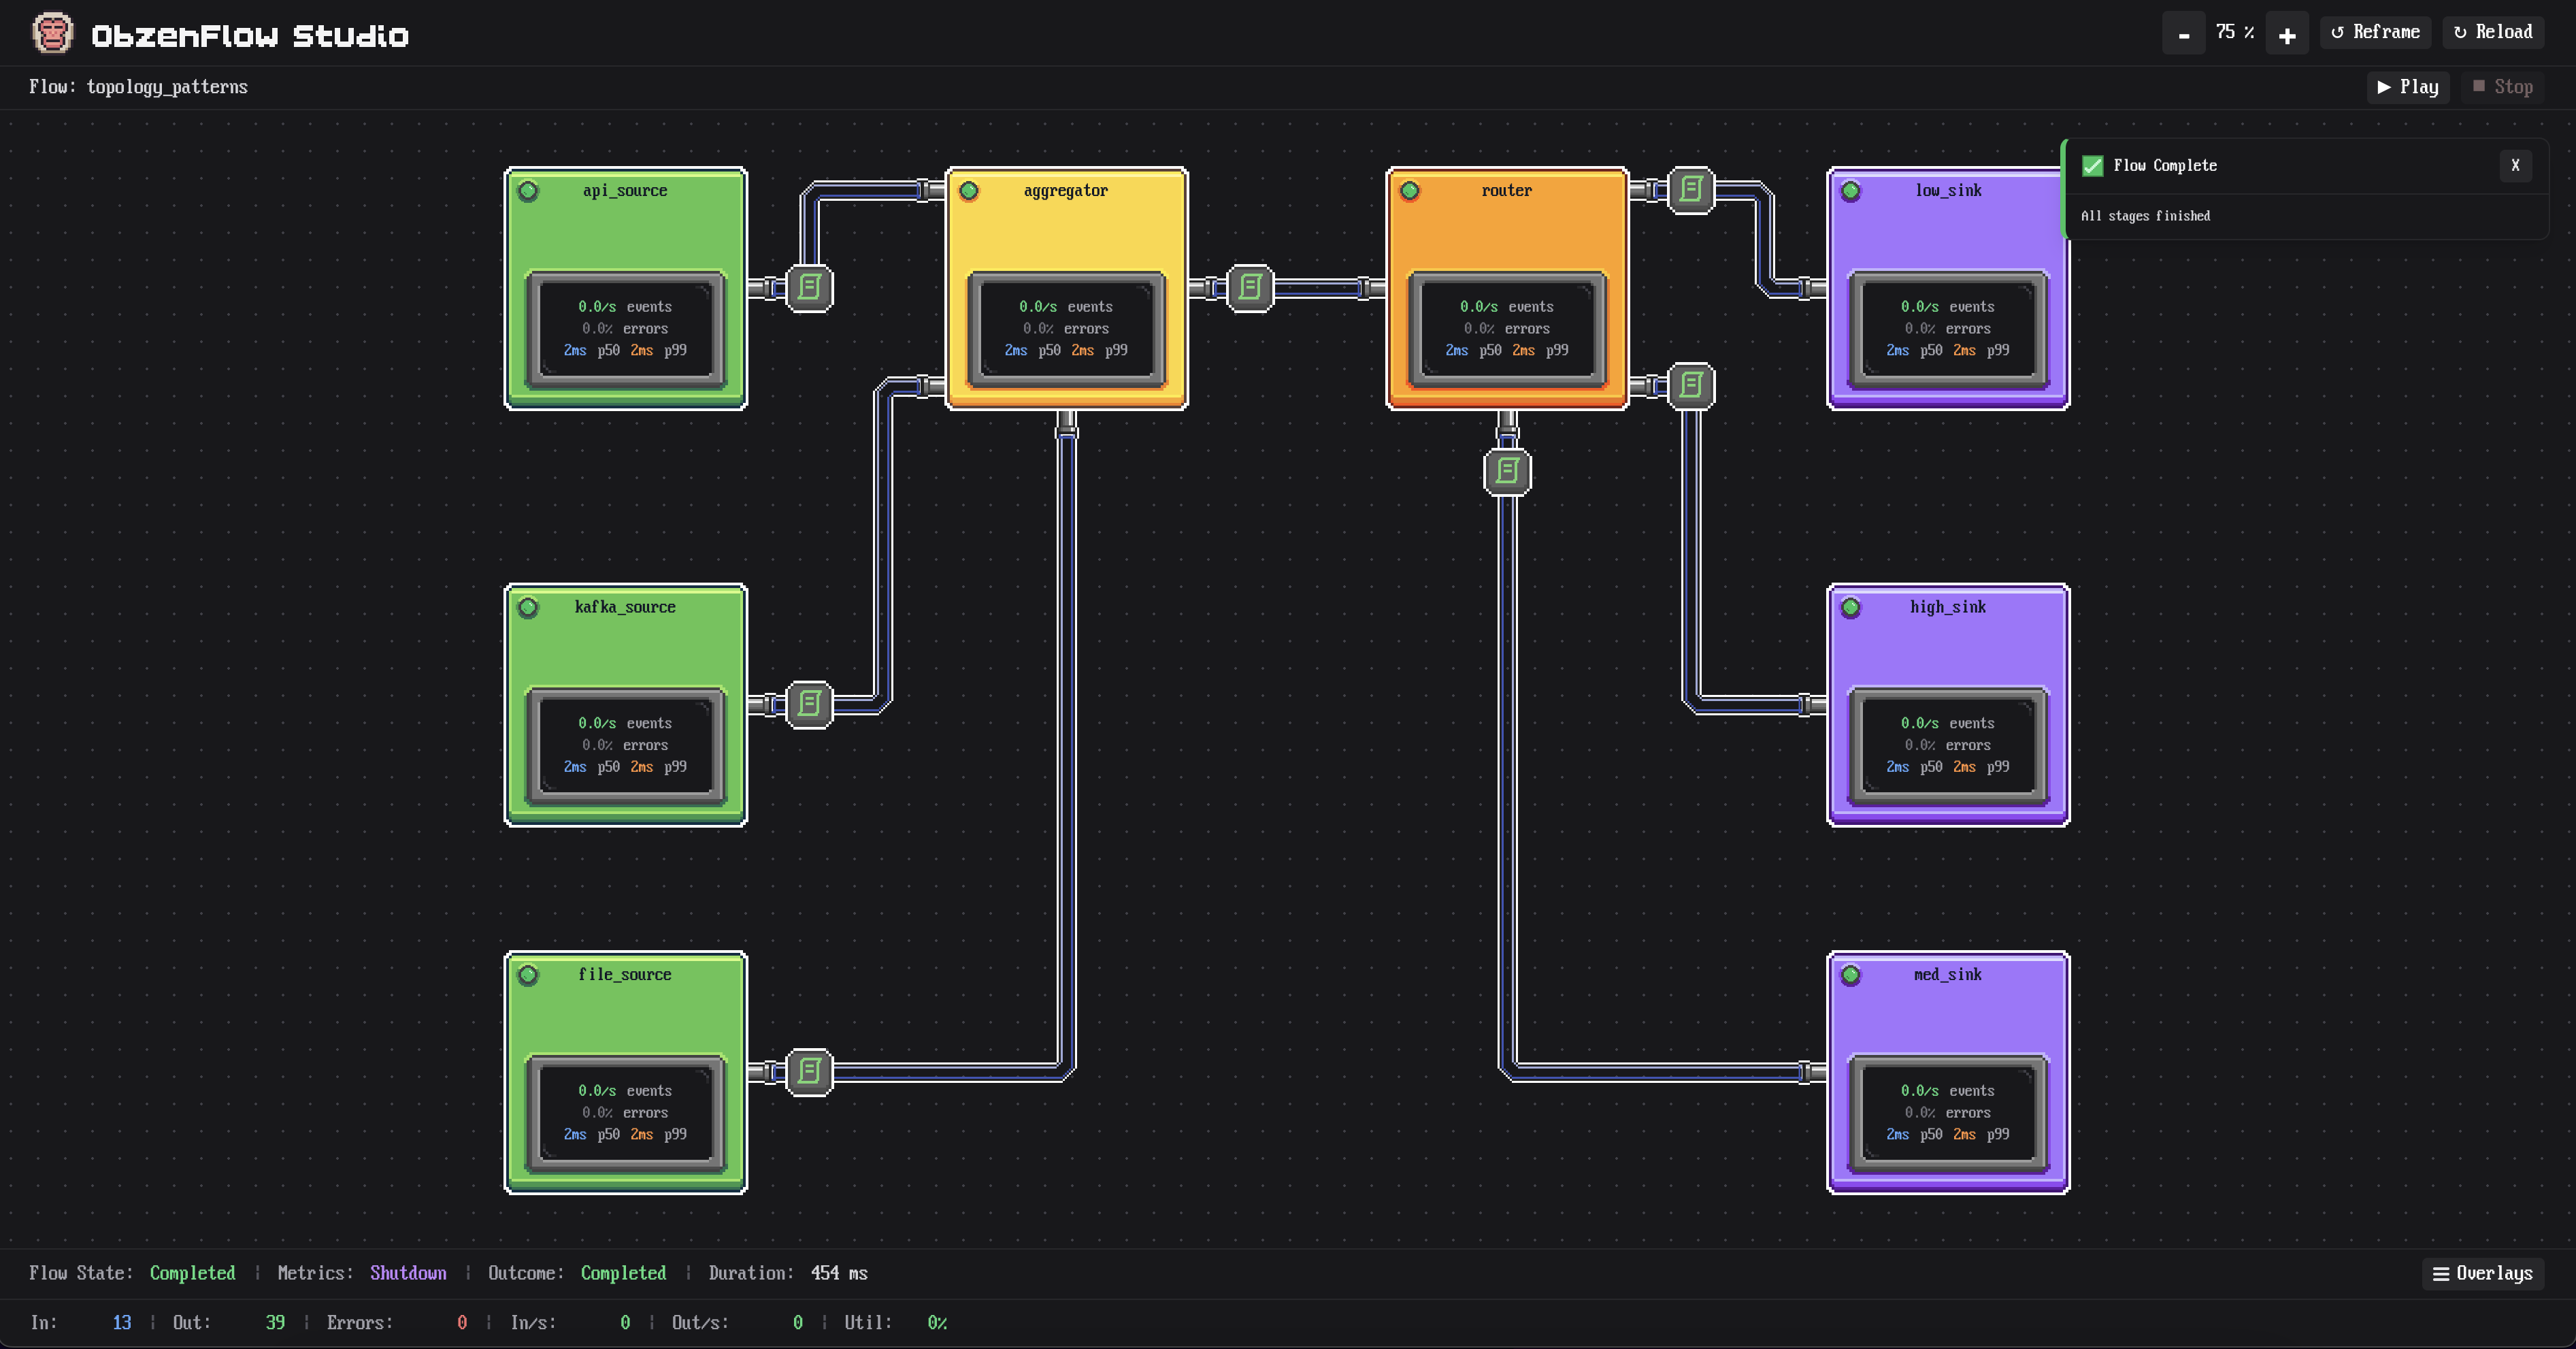
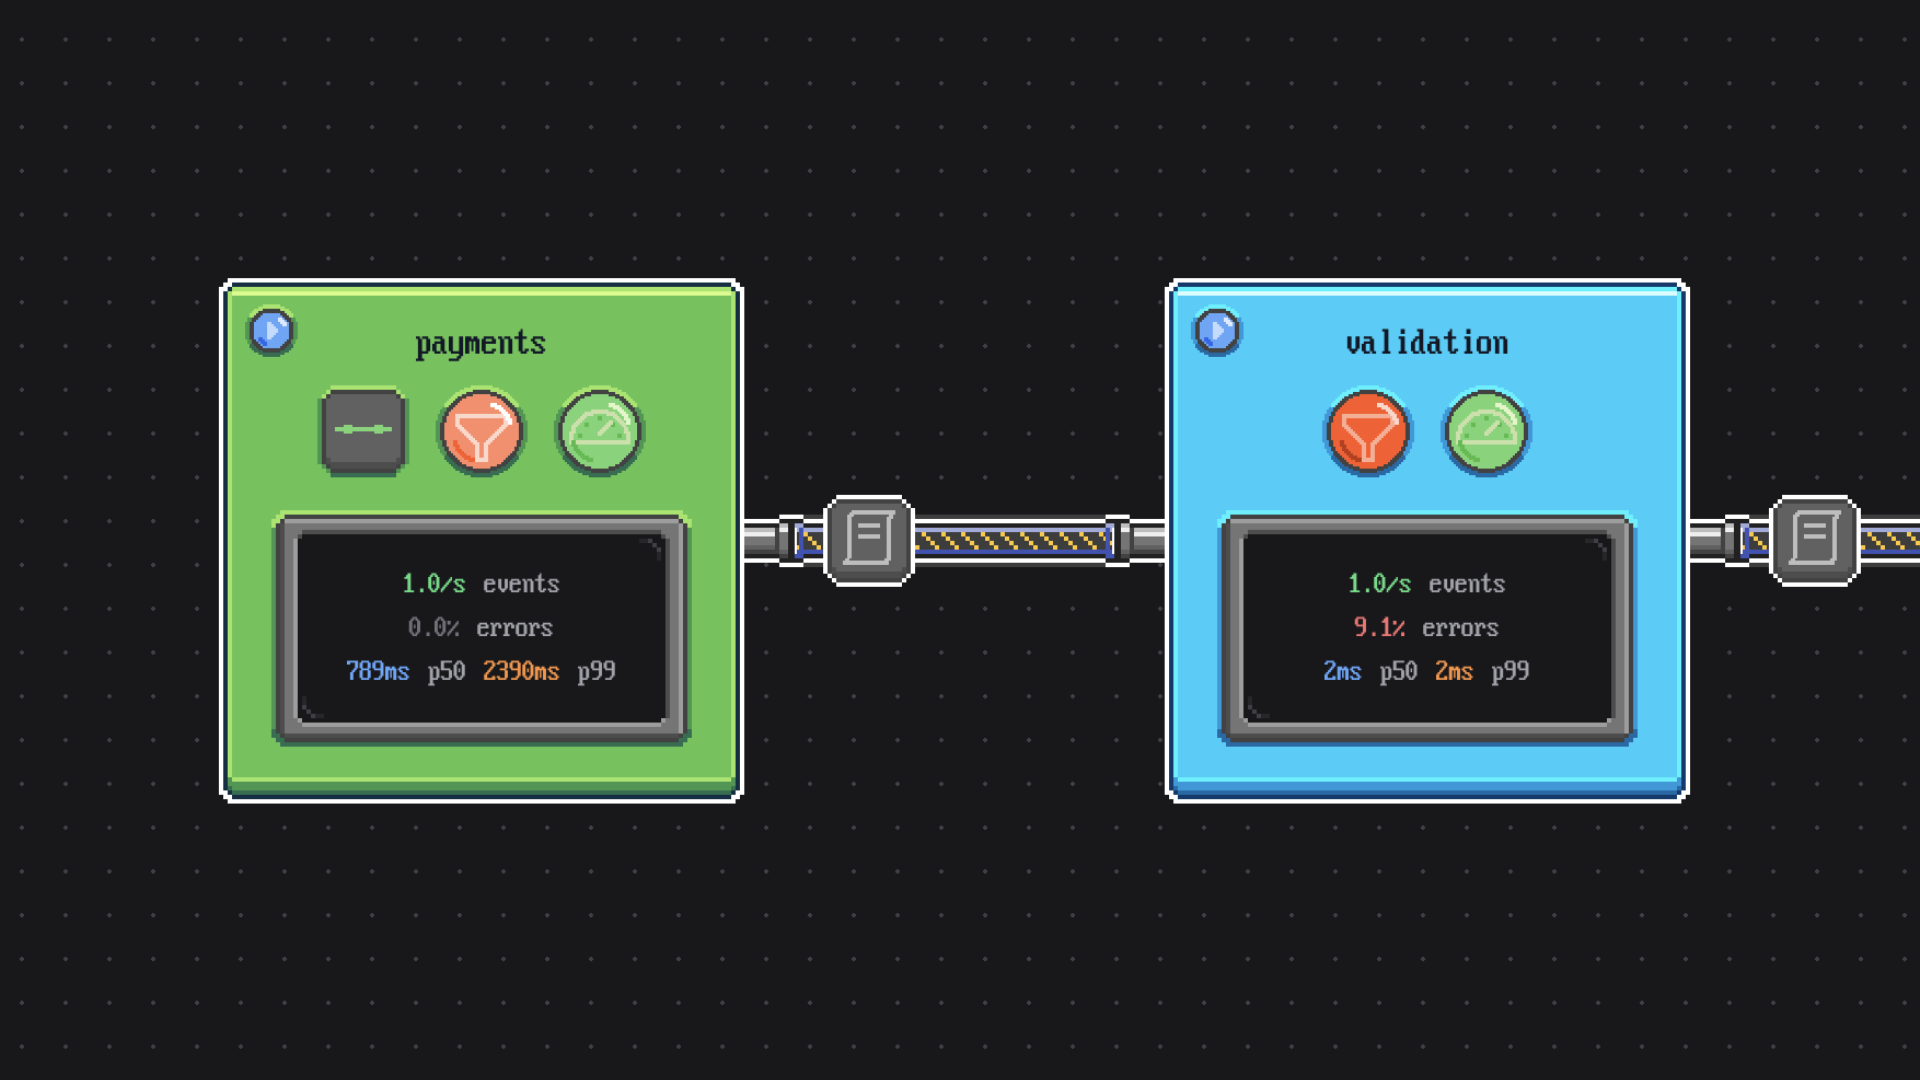
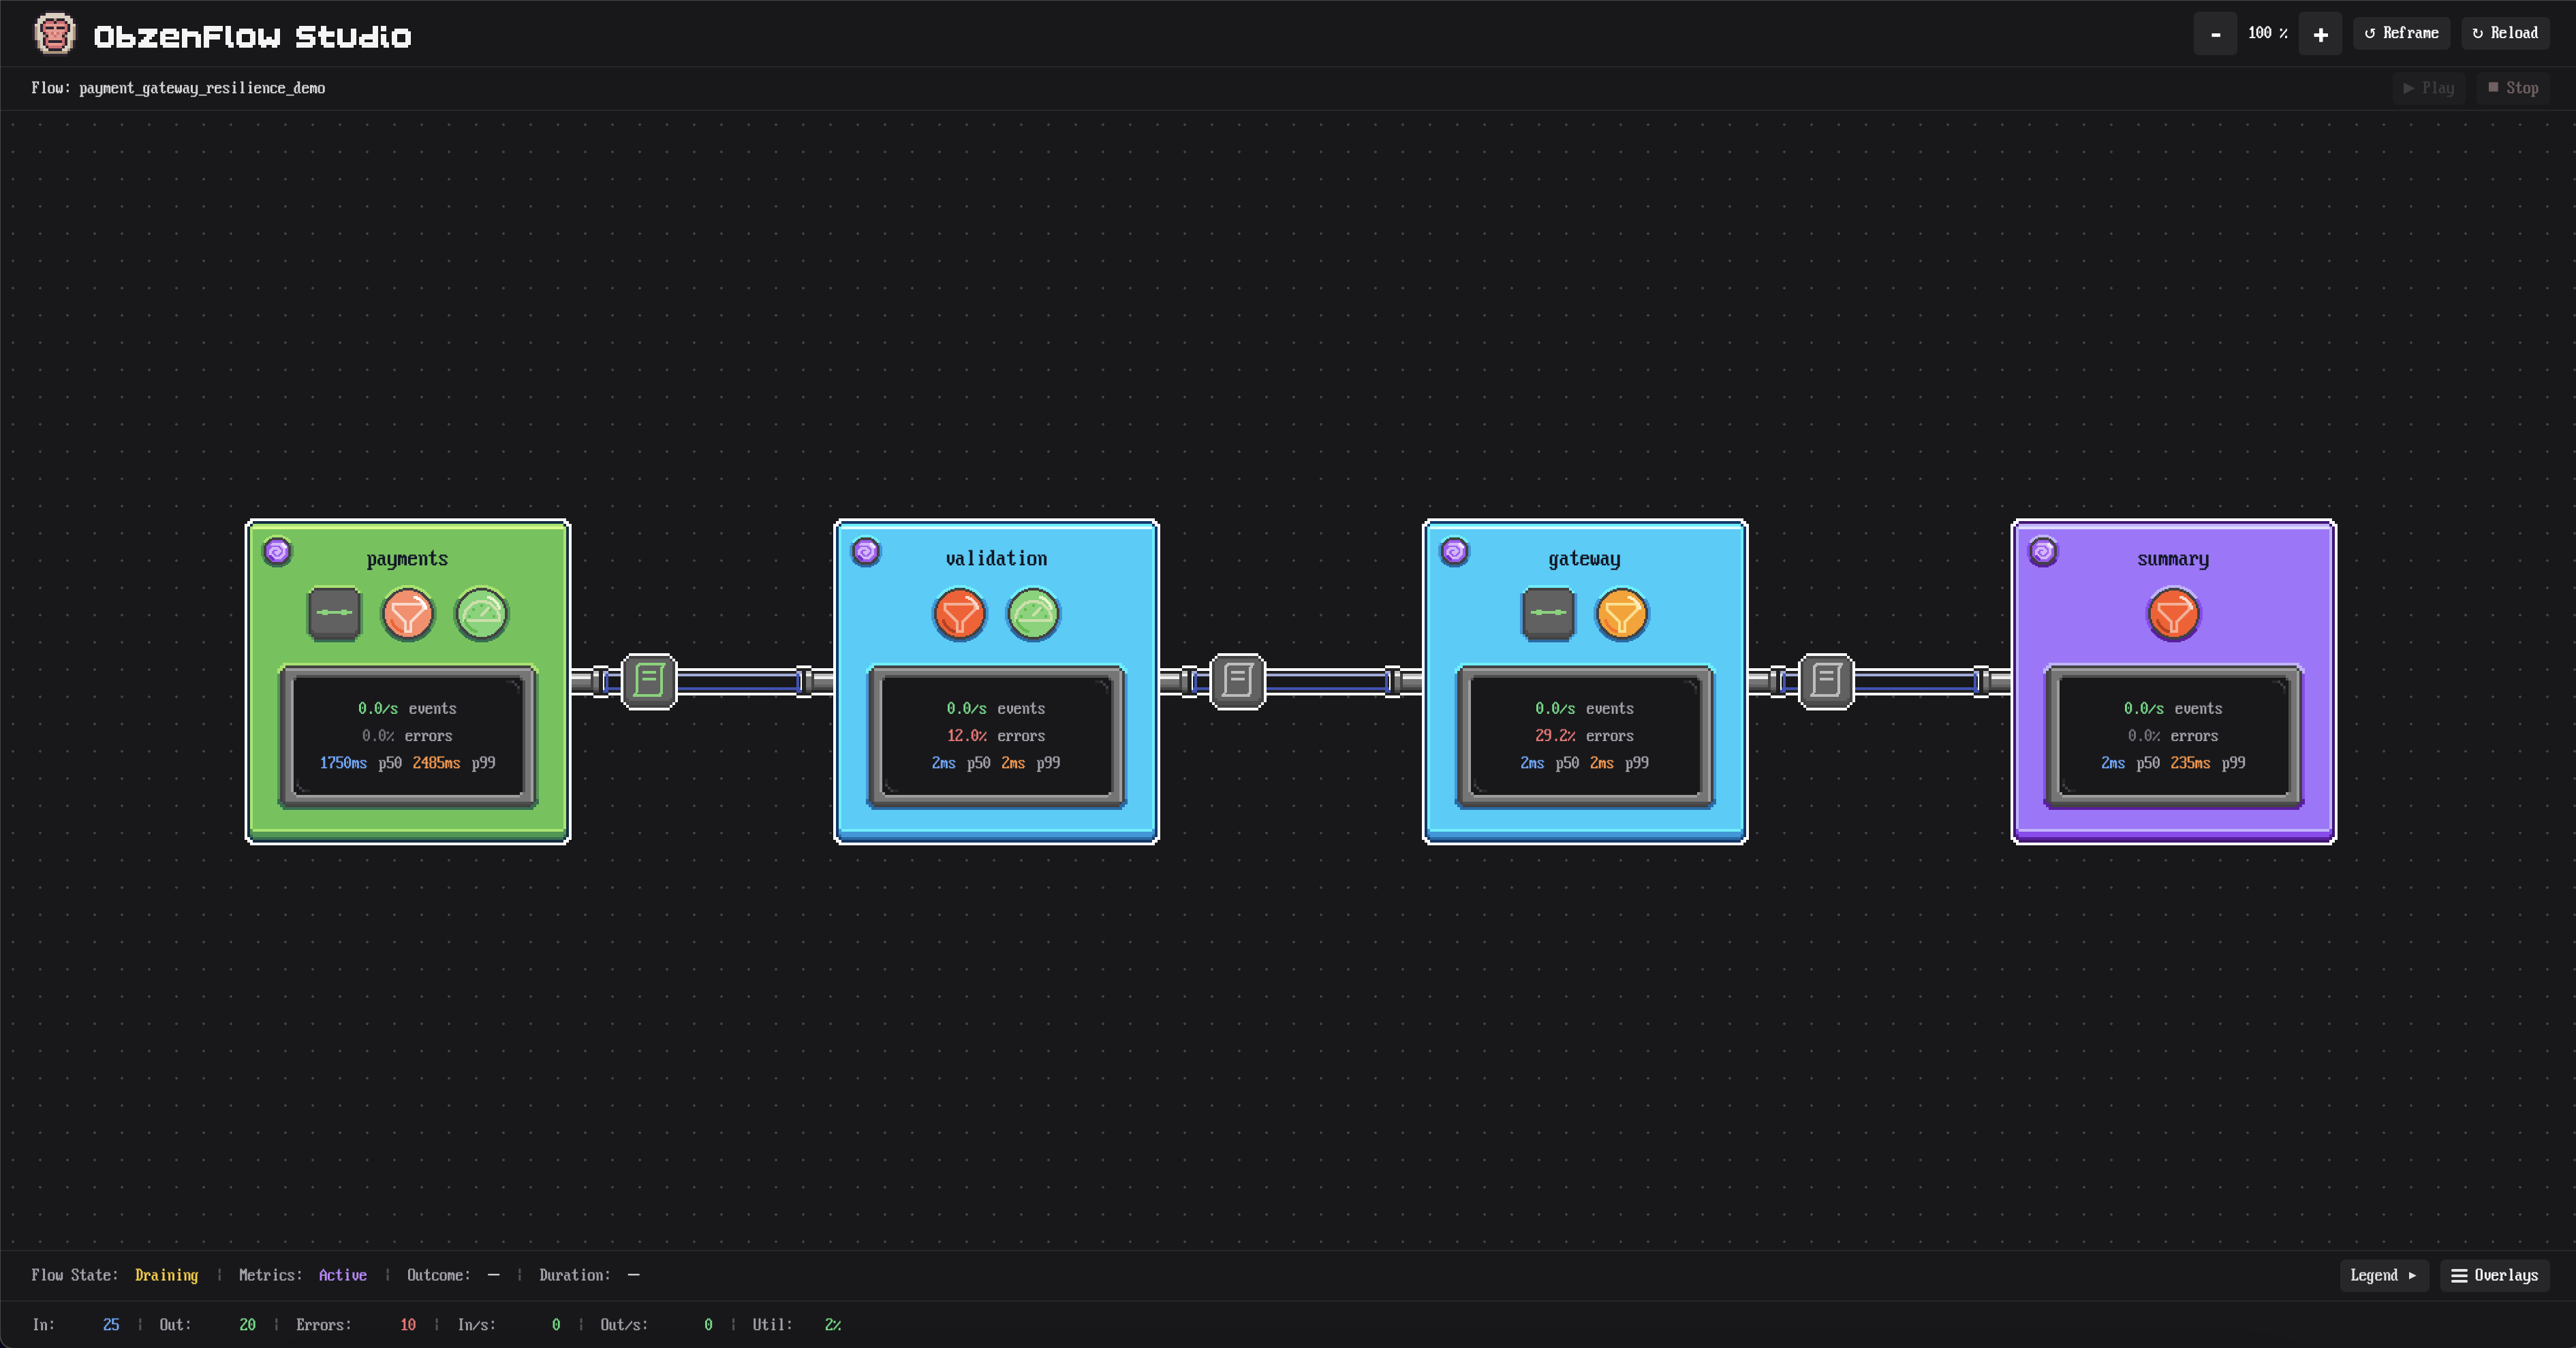
ObzenFlow Studio renders your flow’s topology directly from the running server. Stages appear as colour-coded nodes: green for sources, blue for transforms, purple for sinks, orange for routers, yellow for joins. Connections route around obstacles so dense topologies stay readable. Stages in cycles are marked so feedback loops are visible at a glance.
Four zoom tiers control what level of detail is on screen. Pull back for a bird’s-eye overview of the full graph. Zoom in to see per-stage latency percentiles and middleware state. The layout scales cleanly whether your flow is three stages or a graph with dozens of stages, fan-out, fan-in, and feedback.
No architecture diagram to maintain. No stale Miro board. The topology on screen is the topology that is running.
Diagnose it
Slow stages, blocked edges, and tripped breakers all show up in one place.
Where's the bottleneck?
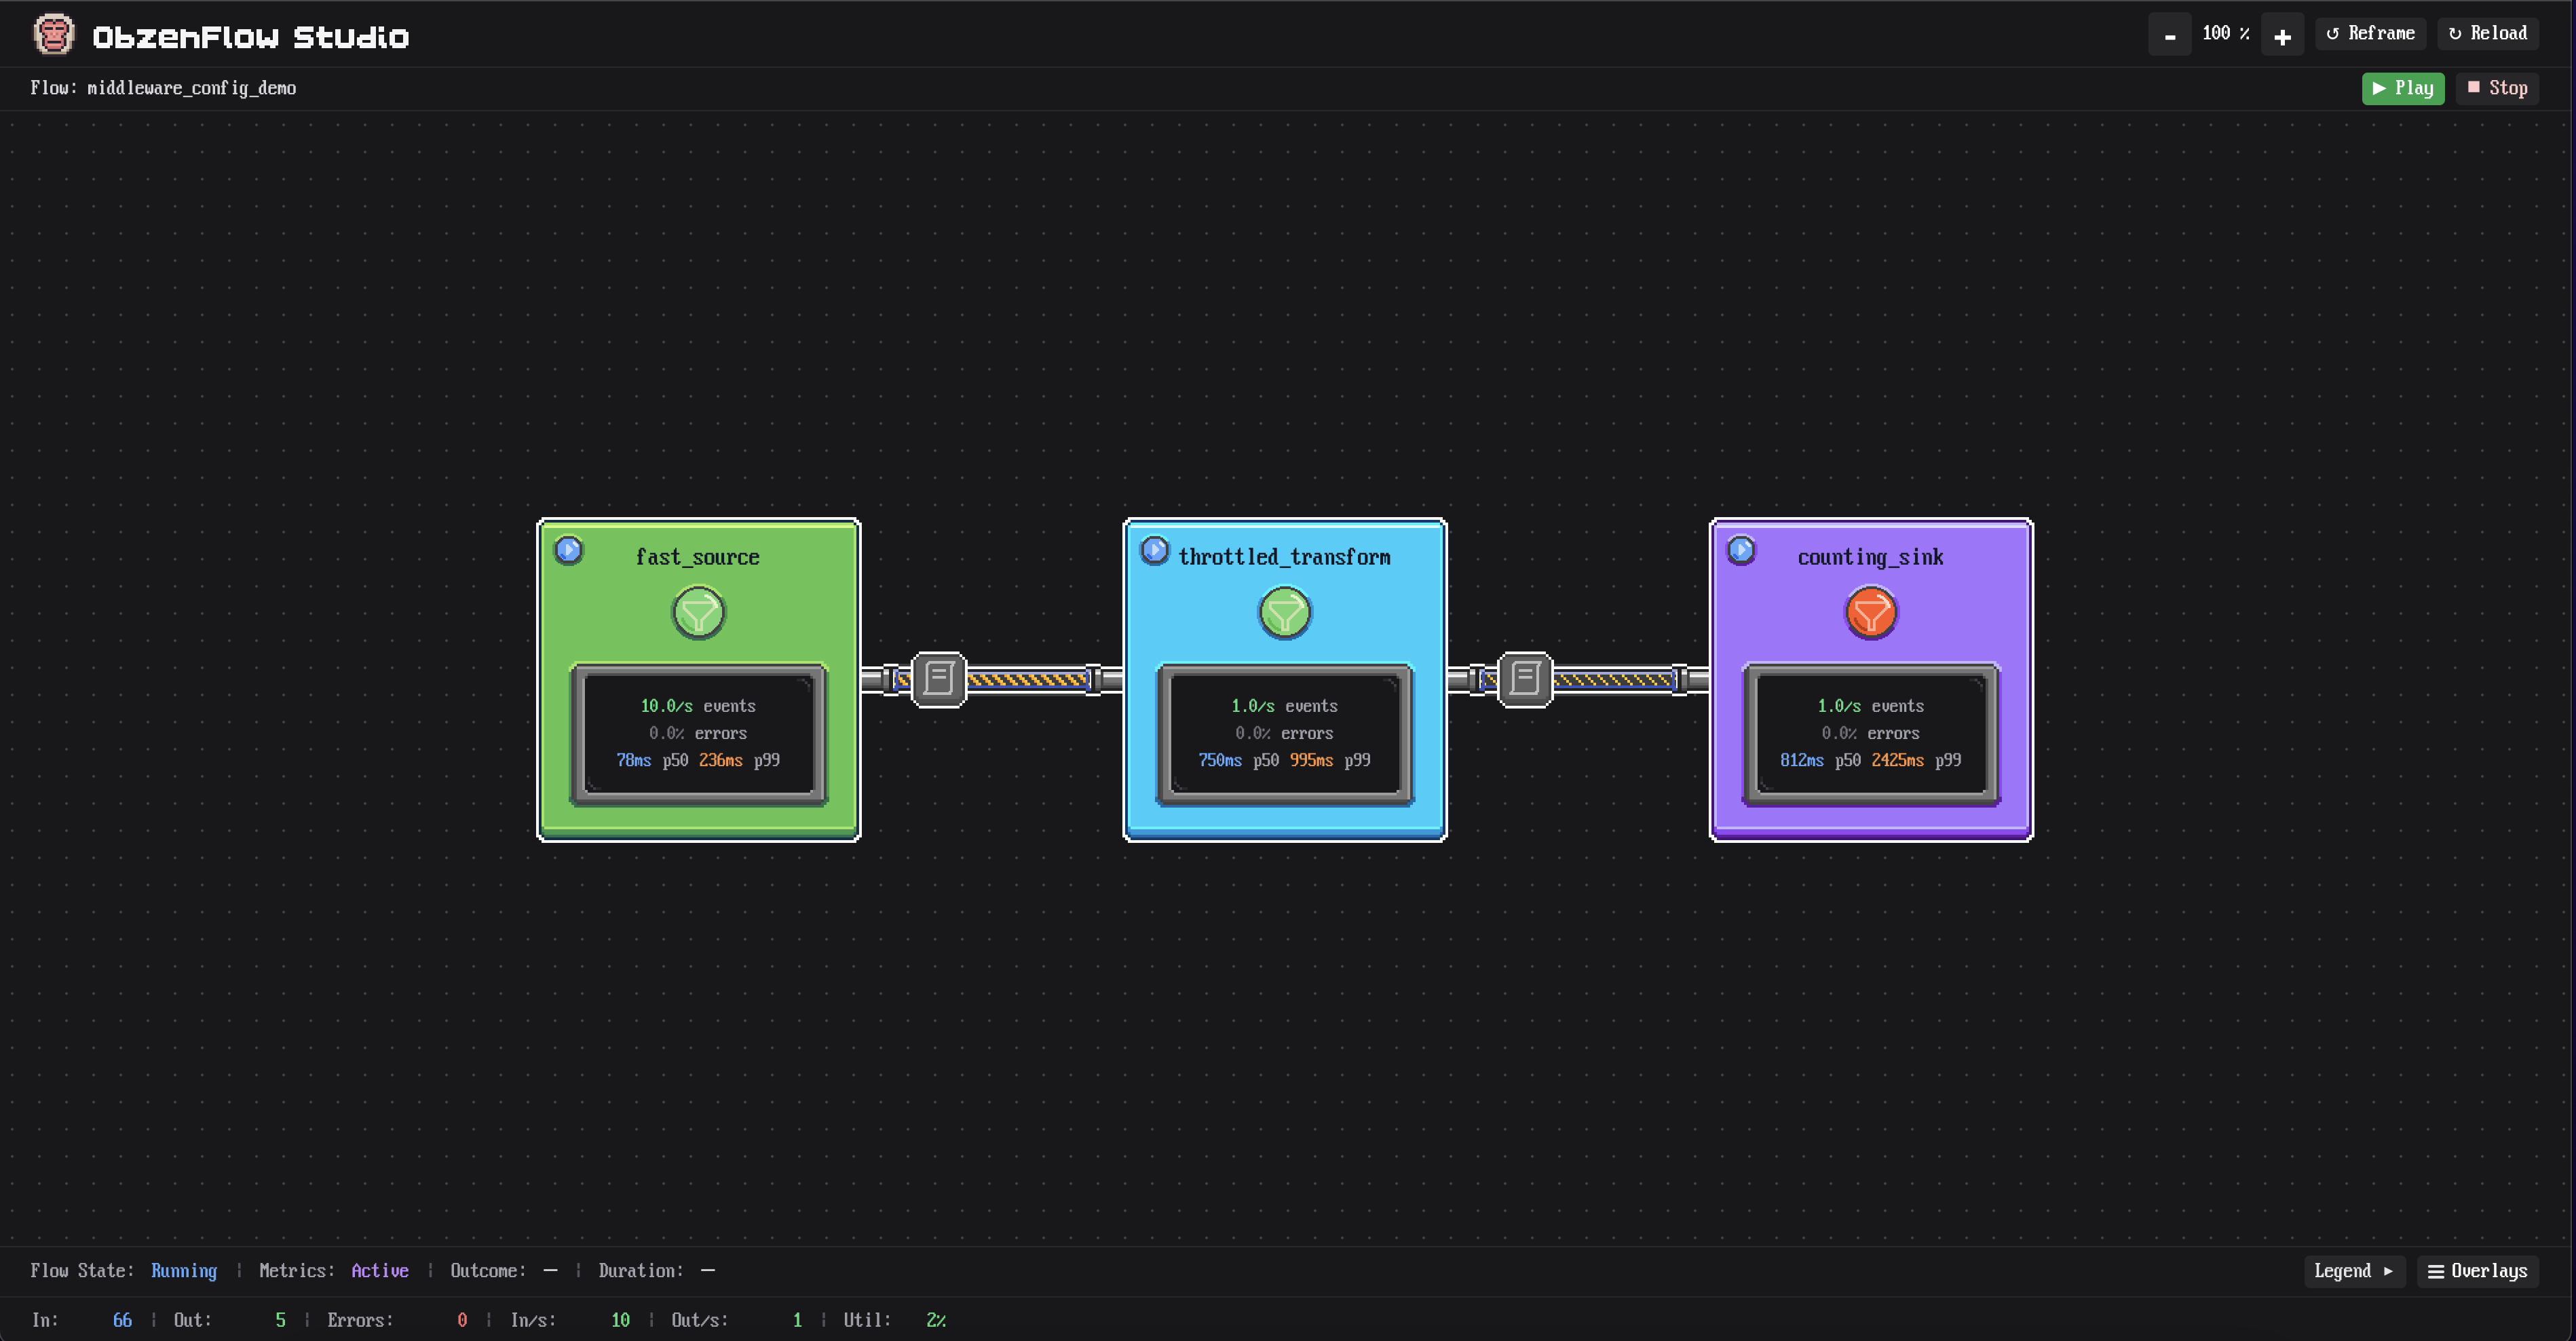
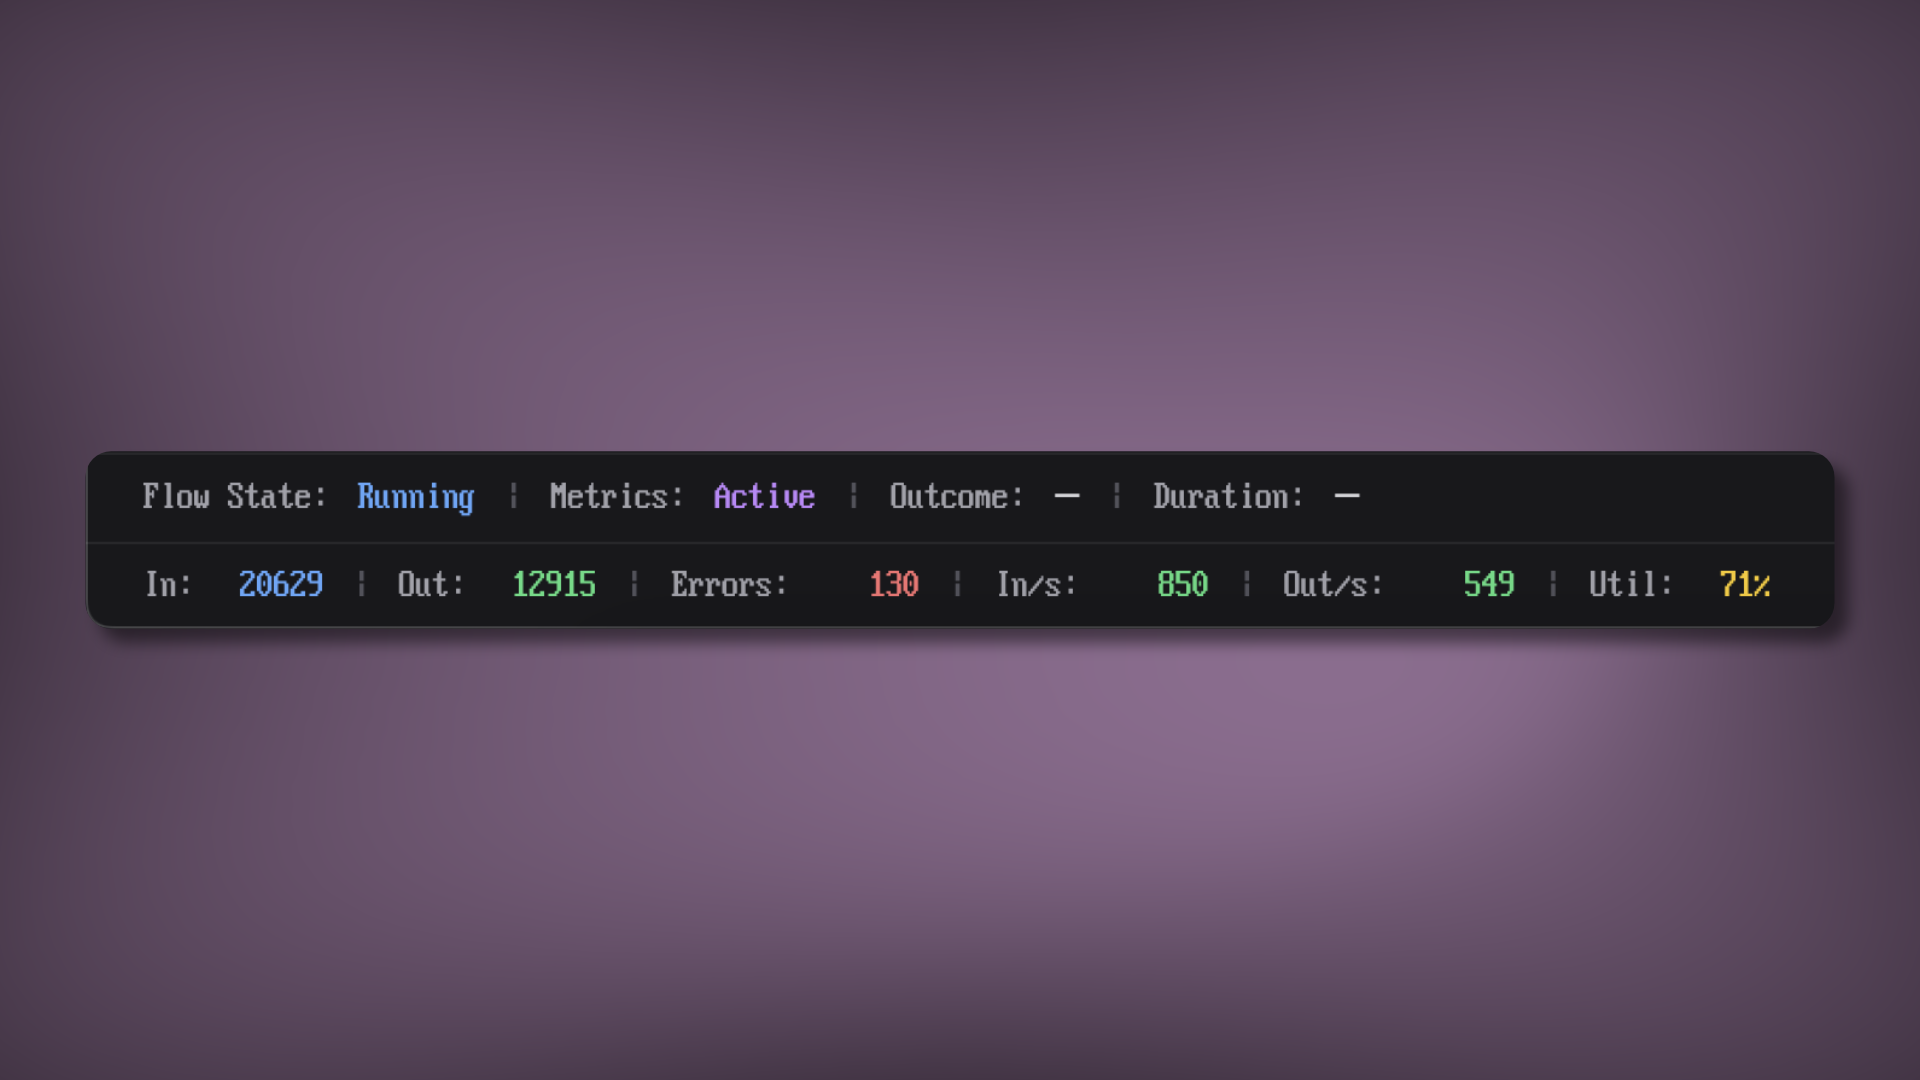
Metrics update every second from the flow’s Prometheus-compatible endpoint. Flow-level numbers appear in a bottom panel: total events in and out, throughput rates, flow utilization, in-flight journeys, and total errors. Each stage displays its own RED metrics directly on the node: rate (events per second), errors (percentage), and duration (P50 and P99 latency), alongside stage state and middleware status when enabled.
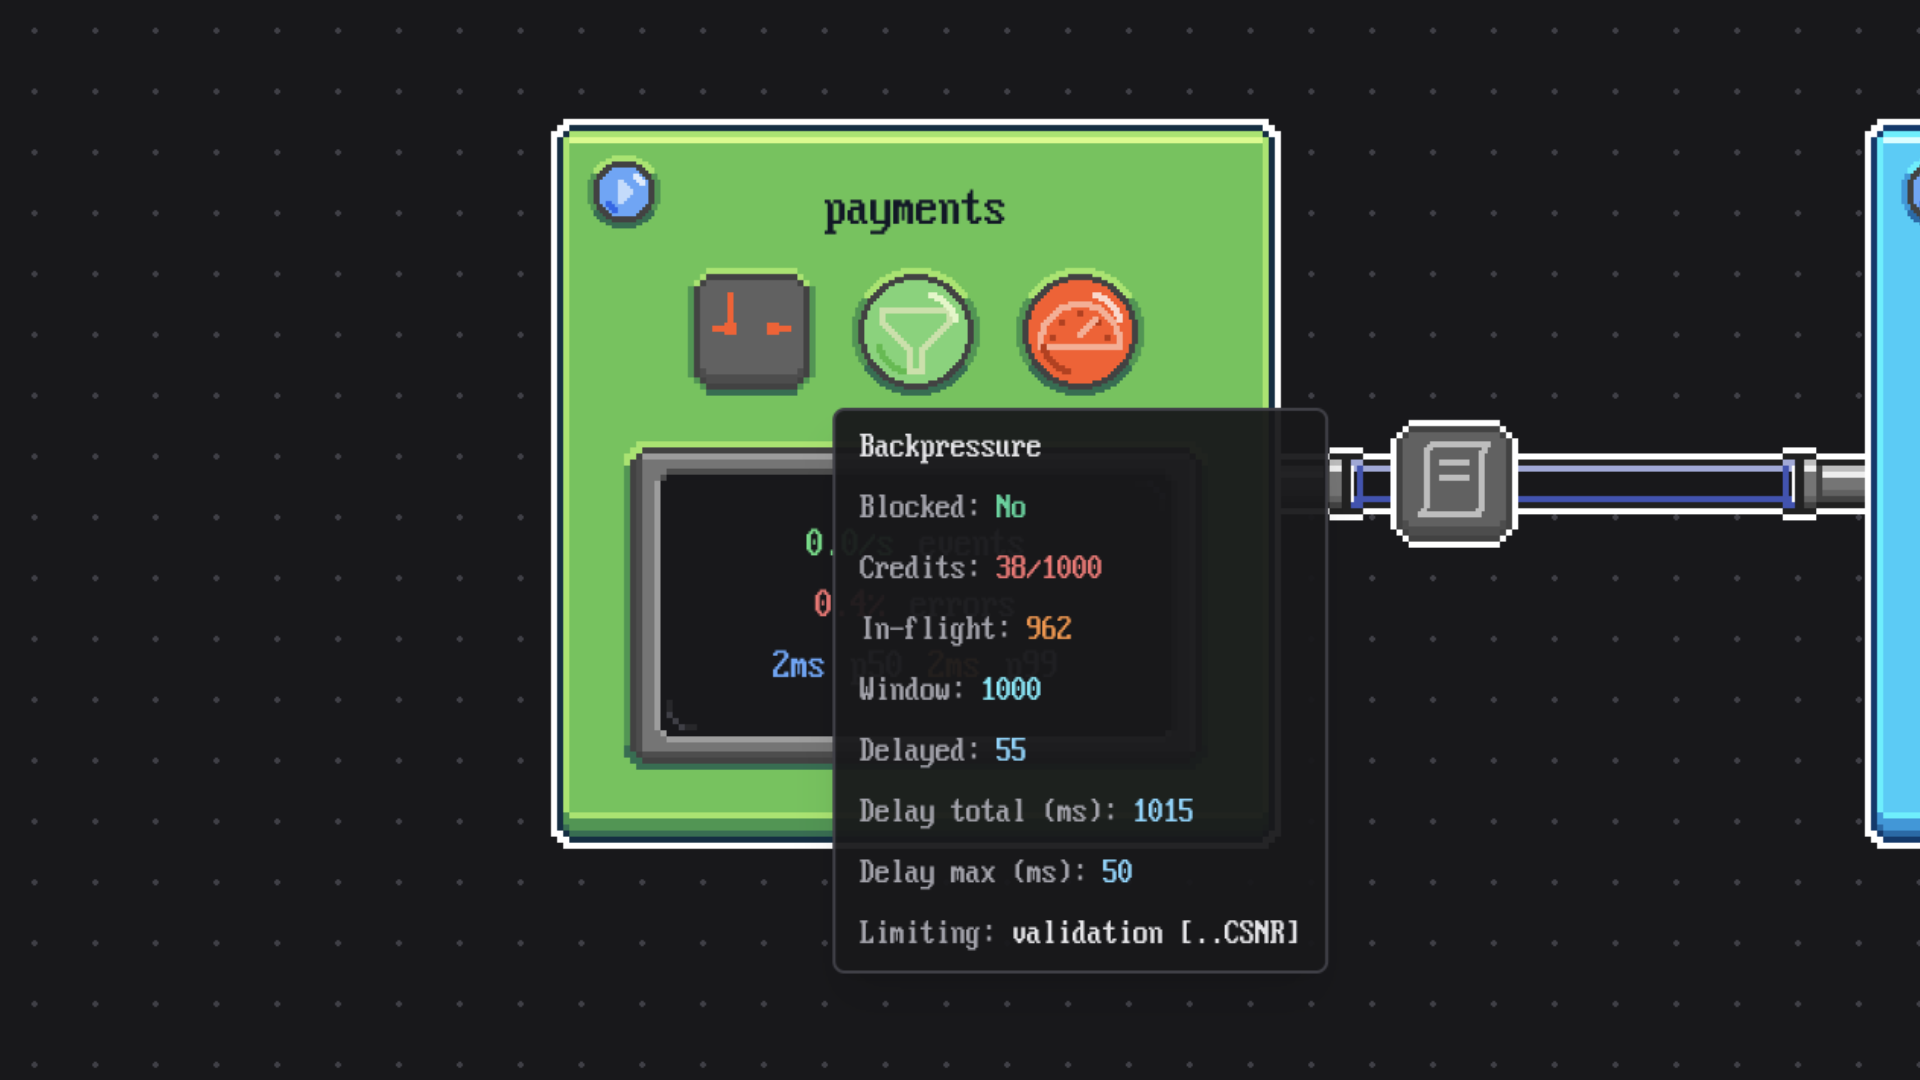
Backpressure is visible on the canvas too. When a stage is blocked, ObzenFlow Studio shows which downstream stage is the bottleneck, the minimum credit level, and the in-flight count at the congested edge. The bottleneck is a visual, not something you infer from a dashboard query.
What broke, and when?
Every middleware primitive is visible directly on the stage it protects. Circuit breakers show their current state (closed, open, or half-open), rejection rate, consecutive failure count, and how long they have been in each state. When a breaker opens, the visual treatment changes immediately. No need to check Prometheus or parse logs to know a dependency is failing.
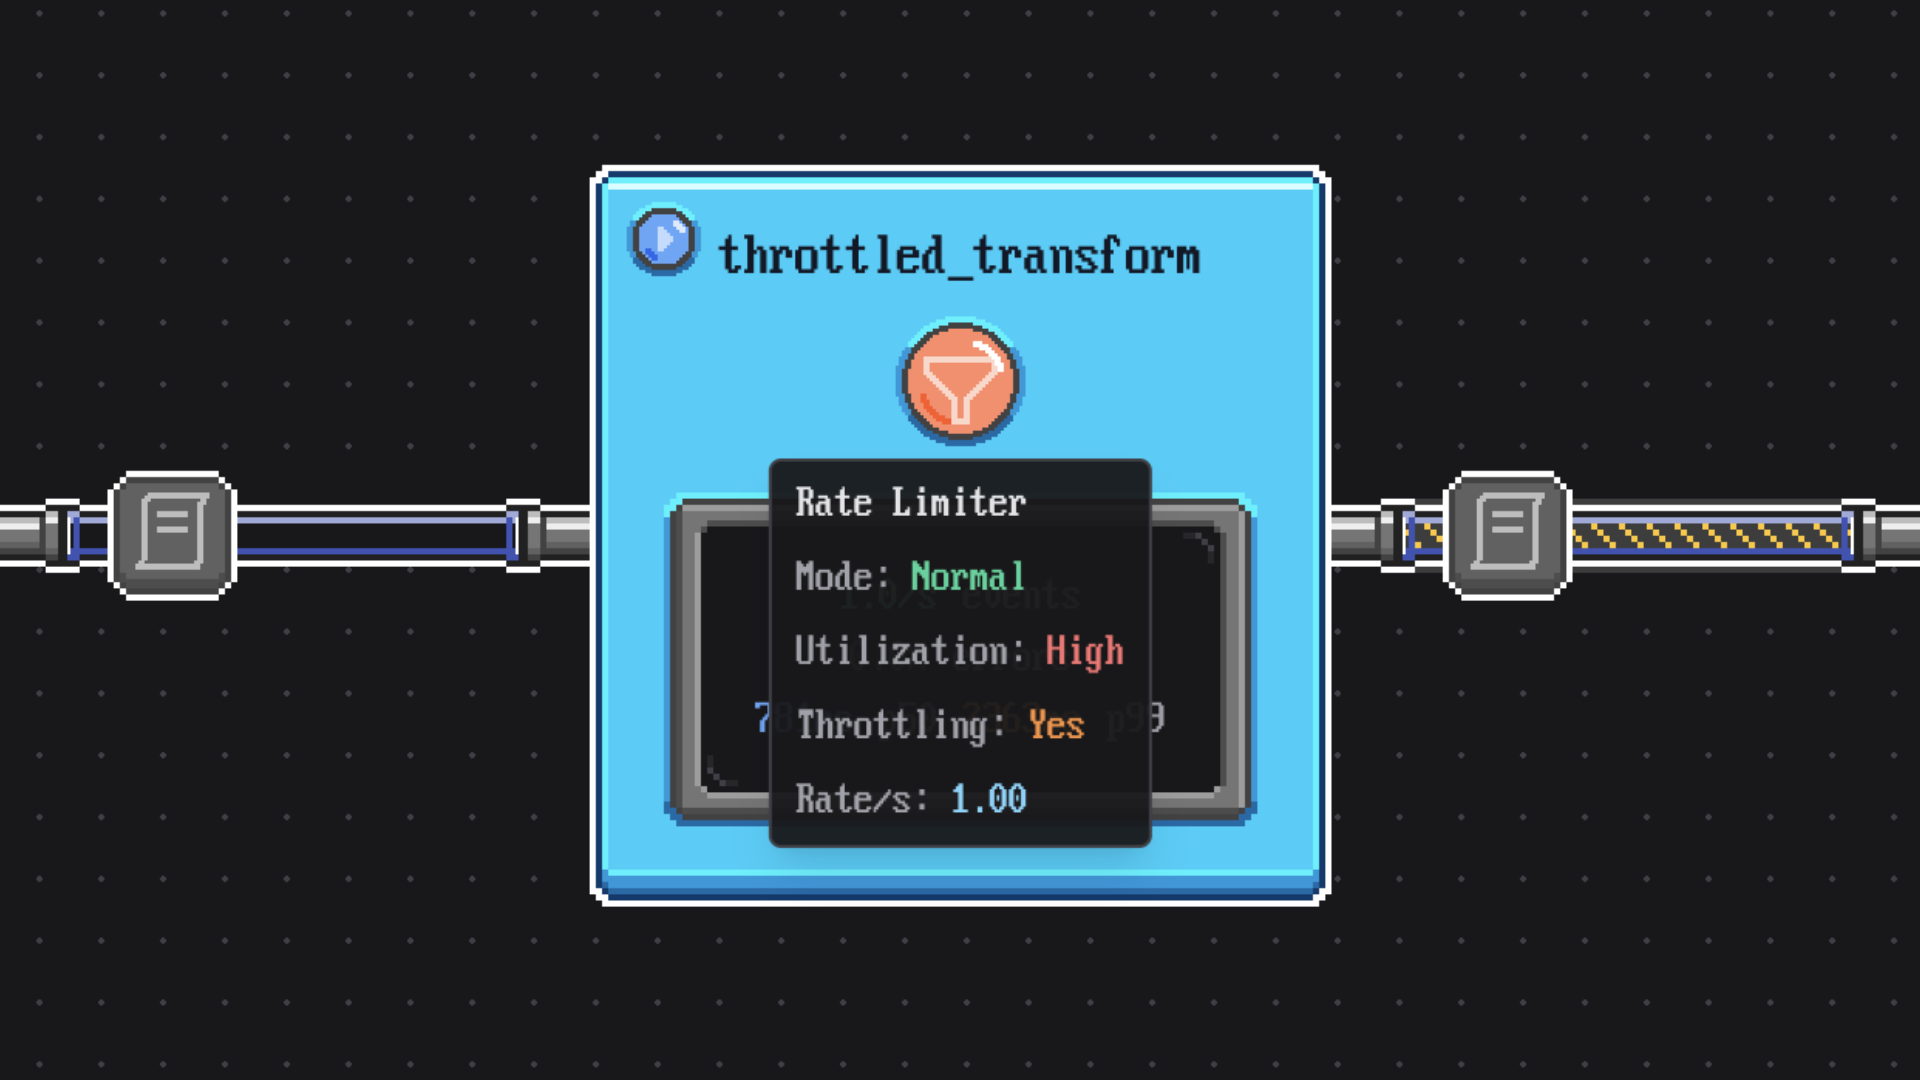
Rate limiters show their current mode, utilization percentage, events in the current window, and how many events have been delayed. Token bucket capacity and current token count are visible. When a limiter begins throttling, the stage pulses to draw attention.
These are the same production-grade primitives you declared in your flow definition. ObzenFlow Studio surfaces their runtime state so you can see them working, not just trust that they are.
Prove it
Every edge proves its own delivery, continuously.
Did events actually arrive?
Every connection in the topology displays the contract status for that edge. Passing contracts show a green badge. Violations show red. Overrides show orange. Pending shows grey. The evidence is continuous, not something you query after the fact. A delivery violation is visible the moment it happens, at the exact point in the topology where it occurred.
Select an edge and ObzenFlow Studio reveals the full evidence: result counts, violation counts, override counts, and the specific reasons when violations occur, whether that is a sequence divergence, a timestamp misalignment, or a lag event.
Most runtimes treat delivery guarantees as a configuration setting you trust. ObzenFlow Studio turns them into evidence you can watch. The badge on the edge is either green or it is not.
Operate it
Operate the flow on the same canvas where you watch it run.
Is the flow running?
ObzenFlow Studio provides direct lifecycle control. Start a flow and stop it gracefully, draining in-flight events before shutdown. The current state is displayed prominently and colour-coded across the full lifecycle: starting, running, draining, completing, drained, completed, cancelled, or failed.
Button states are driven by the actual flow state received from the server, so controls always reflect reality rather than assumed state. When a flow finishes or fails, the duration and final state appear immediately.
How does ObzenFlow Studio connect?
ObzenFlow Studio is compiled to WebAssembly from the same Rust codebase as the framework. Building ObzenFlow from source includes the visual tooling with no additional runtime dependencies. No Electron app. No separate install. No SaaS dashboard to configure.
Run your flow with --server and the backend exposes topology, metrics, and event streams. Launch the ObzenFlow Studio UI and it connects to those endpoints automatically. The topology loads, stages appear on the canvas, and connections are drawn. From that moment, every state change, every metric update, and every middleware event streams to the UI as it happens.
What changes for your team
- Runtime concepts become visible
Watch events move through the topology, see rate limiters begin throttling, and observe circuit breakers open and recover on the canvas.
- Incidents get more direct
Instead of querying metrics, correlating timestamps, or asking what the topology looks like, the current state is visible where the problem is happening.
- Onboarding gets easier
A whiteboard sketch becomes a running demonstration, so teams can learn backpressure, circuit breaking, and delivery contracts from the live system.
Status and availability.
In developmentVisualizes live topology, metrics, middleware state, contract evidence, and lifecycle controls from the running server.
The screenshots and demonstrations on this page describe the current development surface. Treat Studio as preview software; the runtime capabilities it visualizes have their own status.
Next Up
Start building today.
ObzenFlow Studio will be available in fall 2026. In the meantime, learn exactly how to build ObzenFlow applications.