
Observable by design.
ObzenFlow is designed to be understandable at every level. Read any run as one causal timeline with the ObzenFlow CLI. Monitor a running flow through metrics that come directly from wide events, the source of truth. Visualize a running flow on one canvas in ObzenFlow Studio, now in development.
CLI
Read any run as one causal timeline.
obzenflow show prints every stage’s records as one causal timeline, during the run or long after it.
Metrics
Monitor a flow through its wide events.
Every journal record is a wide event, and the runtime builds its Prometheus metrics from those same events.
Studio
Visualize a running flow on one canvas.
Topology, metrics, middleware state, delivery evidence, and lifecycle controls in one place.
CLI
Observability comes straight from event-sourced wide events.
Your journals are a superpower for root cause analysis.
Every decision that matters is recorded to the journal and inspectable. Here, two records from one run show how the payment for order store-4475 failed.
What was decided
The first record is the gateway call’s outcome, a timeout. The second is the fact
authorize_paymentrecorded from it,payment.authorization_unavailable.Which came first
Each record carries its place in the run’s logical clock, so you can see the fact follow the timeout in the same stage’s journal.
Why
Both records carry the same cause. The gateway timed out, so no answer came back.
EFFECT (stage: authorize_payment, journal: 4)
effect.execution_failed ← authorize_payment(payment.order_validated)
⟨1:3,2:11,3:9,4:57,5:11,6:2,7:2,8:2,9:2,10:2⟩
idempotency key: payment-authorize:store-4475
payload schema version: 1
{
  "effect_type": "payment.authorize",
  "observation": {
    "observation": "execution_failed",
    "authority": "port_return",
    "external_completion": "unknown"
  },
  "outcome": "failed",
  "error_type": "timeout",
  "error_message": "processor_timeout_simulated",
  "retry": "retryable"
}

EFFECTFUL TRANSFORM (stage: authorize_payment, journal: 4)
payment.authorization_unavailable ← authorize_payment(payment.order_validated)
⟨1:3,2:11,3:9,4:58,5:11,6:2,7:2,8:2,9:2,10:2⟩
payload schema version: 1
{
  "amount_cents": 1800,
  "customer_id": "cust-3741",
  "order_id": "store-4475",
  "phase": "Outage",
  "reason": "processor_timeout_simulated"
}
Logical clocks show what happened before what.
Every record carries a vector clock, which basically is its own view of order at the time that the record was written.
ObzenFlow has total order per journal and causal order across journals. You can see here that validate_order doesn’t necessarily know or care about what’s happening in store_orders or web_orders unless it attempts to validate an order. That’s causal order. That’s how we maintain ordering without coupling to wall-clock time.
This may seem unimportant, but it’s a debugging superpower to understand what a particular journal’s understanding of ordering across the entire system was at the time it finalized an event.
Concurrent orders stay concurrent
store_ordersandweb_ordersdon’t communicate directly, so they have no opinion on what happened before what, and they don’t need to.Each record shows what its stage had seen
When
validate_orderseesstore_orders, its own clock is updated based on its understanding, but its view ofweb_ordersdoesn’t change.History carries forward
Eventually
validate_ordervisits a web order, and its own clock is incremented and its view ofweb_ordersis updated. This is causal order.
Every record contains its causality, history, and agency.
Every stage journal stores wide events. Beside the payload, each record carries the id of the source event that entered the flow, the ids of the records it was made from, the outcome and event time, and the effect call that produced it. When someone asks why order store-4471 was authorized, the answer is in this record and the records it points to, with no log line or trace to find.
Start with the correlation id
Every record derived from the store order carries the id minted when it entered the flow, in every stage journal. Filter obzenflow show --jsonl on that id and you have the order’s whole story, from the store order to this authorization and its delivery. For most questions that is the answer.
Use causality when one fact has many sources
A running balance is made from dozens of postings and a join from several orders, so filtering on one order finds the output but not the rest of what went into it. Causality names the records an emission was made from, and a keyed output also points at its previous output, so the lineage of a join or a balance is complete.
See the call that produced it
Processing records the outcome and the event time. The effect cursor names the stage, the input and the call that produced this fact, so replay returns the recorded gateway decision instead of calling the gateway again.
Read the fact
The payload is the authorization as the stage recorded it, and it is never edited or deleted. A correction is a new fact appended after it. Societies have run on append-only journals of facts since double-entry accounting.
{
  …
  "kind": "stage_output",
  "record": {
    "envelope": {
      "provenance": {
        "event": {
          "id": "3F2QN67Z2VNN3QTP5680D9PGDF",
          …
          "causality": {
            "parent_ids": [
              "01M5WS0C35F1RD3A1YKT9W3HQJ",
              "01M5WS0C33TJAA9R26FX679W6H"
            ]
          },
          …
          "processing": {
            "event_time": 1000,
            "status": "Success"
          },
          "correlation": {
            "ids": ["01M5WS0C33NA8DK0CKANZ75FR3"]
          },
          "effect_provenance": {
            "cursor": {
              "stage_key": "authorize_payment",
              "input_seq": 1,
              "effect_ordinal": 0
            },
            …
    "payload": {
      "amount_cents": 8640,
      "authorization_id": "AUTH-DEMO-1234",
      "customer_id": "cust-1187",
      "order_id": "store-4471",
      "phase": "Warmup"
    }
  }
}
Read and check every run from the terminal.
The ObzenFlow CLI ships in the main repository behind the cli feature. It reads a run’s journal files directly, during the run or long after it, and never alters them.
Show the journals
Read the event-sourced records themselves: every stage’s facts in one causal timeline, with what caused each one.
Inspect the manifest
See how a run ended, which schema wrote it, which journal file holds each stage, and where every record sits, without opening a single record.
Verify two runs
Compare a replay with its original run. The verdict comes back as an exit code your CI can act on.
$ obzenflow show $RUN --compact
EFFECT  effect.execution_failed ← authorize_payment(payment.order_vali… [--full]
EFFECTFUL TRANSFORM  payment.authorization_unavailable ← authorize_pay… [--full]
DELIVERY  delivery.succeeded ← manual_review(payment.authorization_una… [--full]
DELIVERY  delivery.succeeded ← paid_orders(payment.authorized)  {"subj… [--full]
TRANSFORM  payment.order_validated ← validate_order(commerce.customer_… [--full]
EFFECTFUL TRANSFORM  payment.authorized ← authorize_payment(payment.or… [--full]
EFFECTFUL TRANSFORM  payment.authorized ← authorize_payment(payment.or… [--full]
$ obzenflow inspect $RUN
flow_id:    flow_01M7H7NPKCNKY87R8P9N65E8J1
flow_name:  payment_gateway_resilience_demo
status:     Completed
schema:     23.0
stages:     9

[authorize_payment] Transform_authorize_payment_stage_01M7H7NPK6HM6T7H9MK2GF4W97.log (Transform)
           0  supervisor.stage.authorize_payment.registered
         510  supervisor.stage.authorize_payment.ready
$ obzenflow verify --baseline $RUN --candidate $REPLAY
output matched the original run, 0 differences
Metrics
Metrics come directly from the source of truth.
One scrape serves the golden signals, RED and USE.
With the prometheus feature on, /metrics serves the aggregator’s latest snapshot. Every series is folded from journal records, so the standard methods need no instrumentation in your handlers. The repository includes Grafana dashboards for the flow and for each stage.
Golden signals for the flow
Traffic as events in from sources and out through sinks, errors across every stage, latency end to end as a histogram, and saturation as flow utilization.
RED for every stage
Rate from the stage’s event counter, errors by kind from its error journal, and duration as a histogram of processing time with the standard Prometheus buckets.
USE for every stage and edge
Utilization from the stage’s rate limiter. Saturation from each edge’s remaining credits, events in flight and time spent blocked. Errors are the counters RED already reads, and an edge’s contract lag sits here too.
obzenflow_flow_events_in_total{flow="payment_gateway_resilience_demo",…} 25
obzenflow_flow_events_out_total{flow="payment_gateway_resilience_demo",…} 20
obzenflow_flow_errors_total{flow="payment_gateway_resilience_demo",…} 0
obzenflow_flow_latency_seconds_bucket{…,le="1"} 18
obzenflow_flow_latency_seconds_bucket{…,le="+Inf"} 20
obzenflow_flow_utilization{flow="payment_gateway_resilience_demo",…} 0.62

obzenflow_events_total{stage="validate_order",…} 25
obzenflow_events_total{stage="authorize_payment",…} 17
obzenflow_errors_total{stage="authorize_payment",…} 0
obzenflow_processing_time_seconds_bucket{stage="authorize_payment",le="1",…} 15
obzenflow_processing_time_seconds_bucket{stage="authorize_payment",le="+Inf",…} 17

obzenflow_rate_limiter_utilization{stage="web_orders",…} 0.91
obzenflow_backpressure_credits{downstream="authorize_payment",…} 1
obzenflow_backpressure_in_flight{downstream="authorize_payment",…} 7
obzenflow_backpressure_wait_seconds_total{stage="validate_order",…} 3.4
obzenflow_contract_lag_events{contract="DeliveryContract",…} 0
Each change arrives as a frame with its journal position.
/api/flow/events is a server-sent events stream. A connection opens its own readers over the stage and system journals, reads what it has not yet seen, then tails them, projecting each record into a frame named for what changed.
A frame per change
Stage lifecycle, throughput, breaker and rate limiter transitions and contract results each arrive under their own
event:name, with the JSON for that change indata:.Each frame carries its commit
The data names the journal commit the frame was projected from, its sequence and its vector clock, so a frame can be matched to the record
obzenflow showprints.Reconnect where you left off
The last frame of every batch carries an
id:holding each journal’s applied position. Send it back asLast-Event-IDand the new connection continues from those positions instead of reading the journals from the start.
event:bootstrap
data:{"event_type":"flow_bootstrap",…}

event:stage_lifecycle
data:{…,"event_type":"stage_running","commitment":{…,"sequence":61,…},…}

event:throughput_update
data:{"stages":[{…,"measurement":{"events_per_second":4.8,…}},…],…}

event:middleware_lifecycle
data:{…,"middleware":"circuit_breaker",…,"state_to":"open",…}

event:contract_result
data:{…,"reader_seq":10,"contract_name":"DeliveryContract","status":"passed",…}
id:jr1:{"01M5WS0BYJ…":61,"01M5WS0BYK…":14,…}
The process itself answers liveness and readiness.
/health says the process is up. /ready says the flow is running. Neither opens a journal and both skip authentication, so load balancer and Kubernetes probes can call them as they are.
Liveness
/healthanswers 200 OK for as long as the process is up, whatever state the flow is in.Readiness
/readyanswers 200 READY only while the flow is running. Before that point, and from the moment it starts draining, it answers 503 NOT_READY, so a load balancer stops routing to it while it drains.
GET /health
200 OK

GET /ready
200 READY

GET /ready            # while draining
503 NOT_READY
Studio
Your flow at a glance.
What does your flow look like right now?
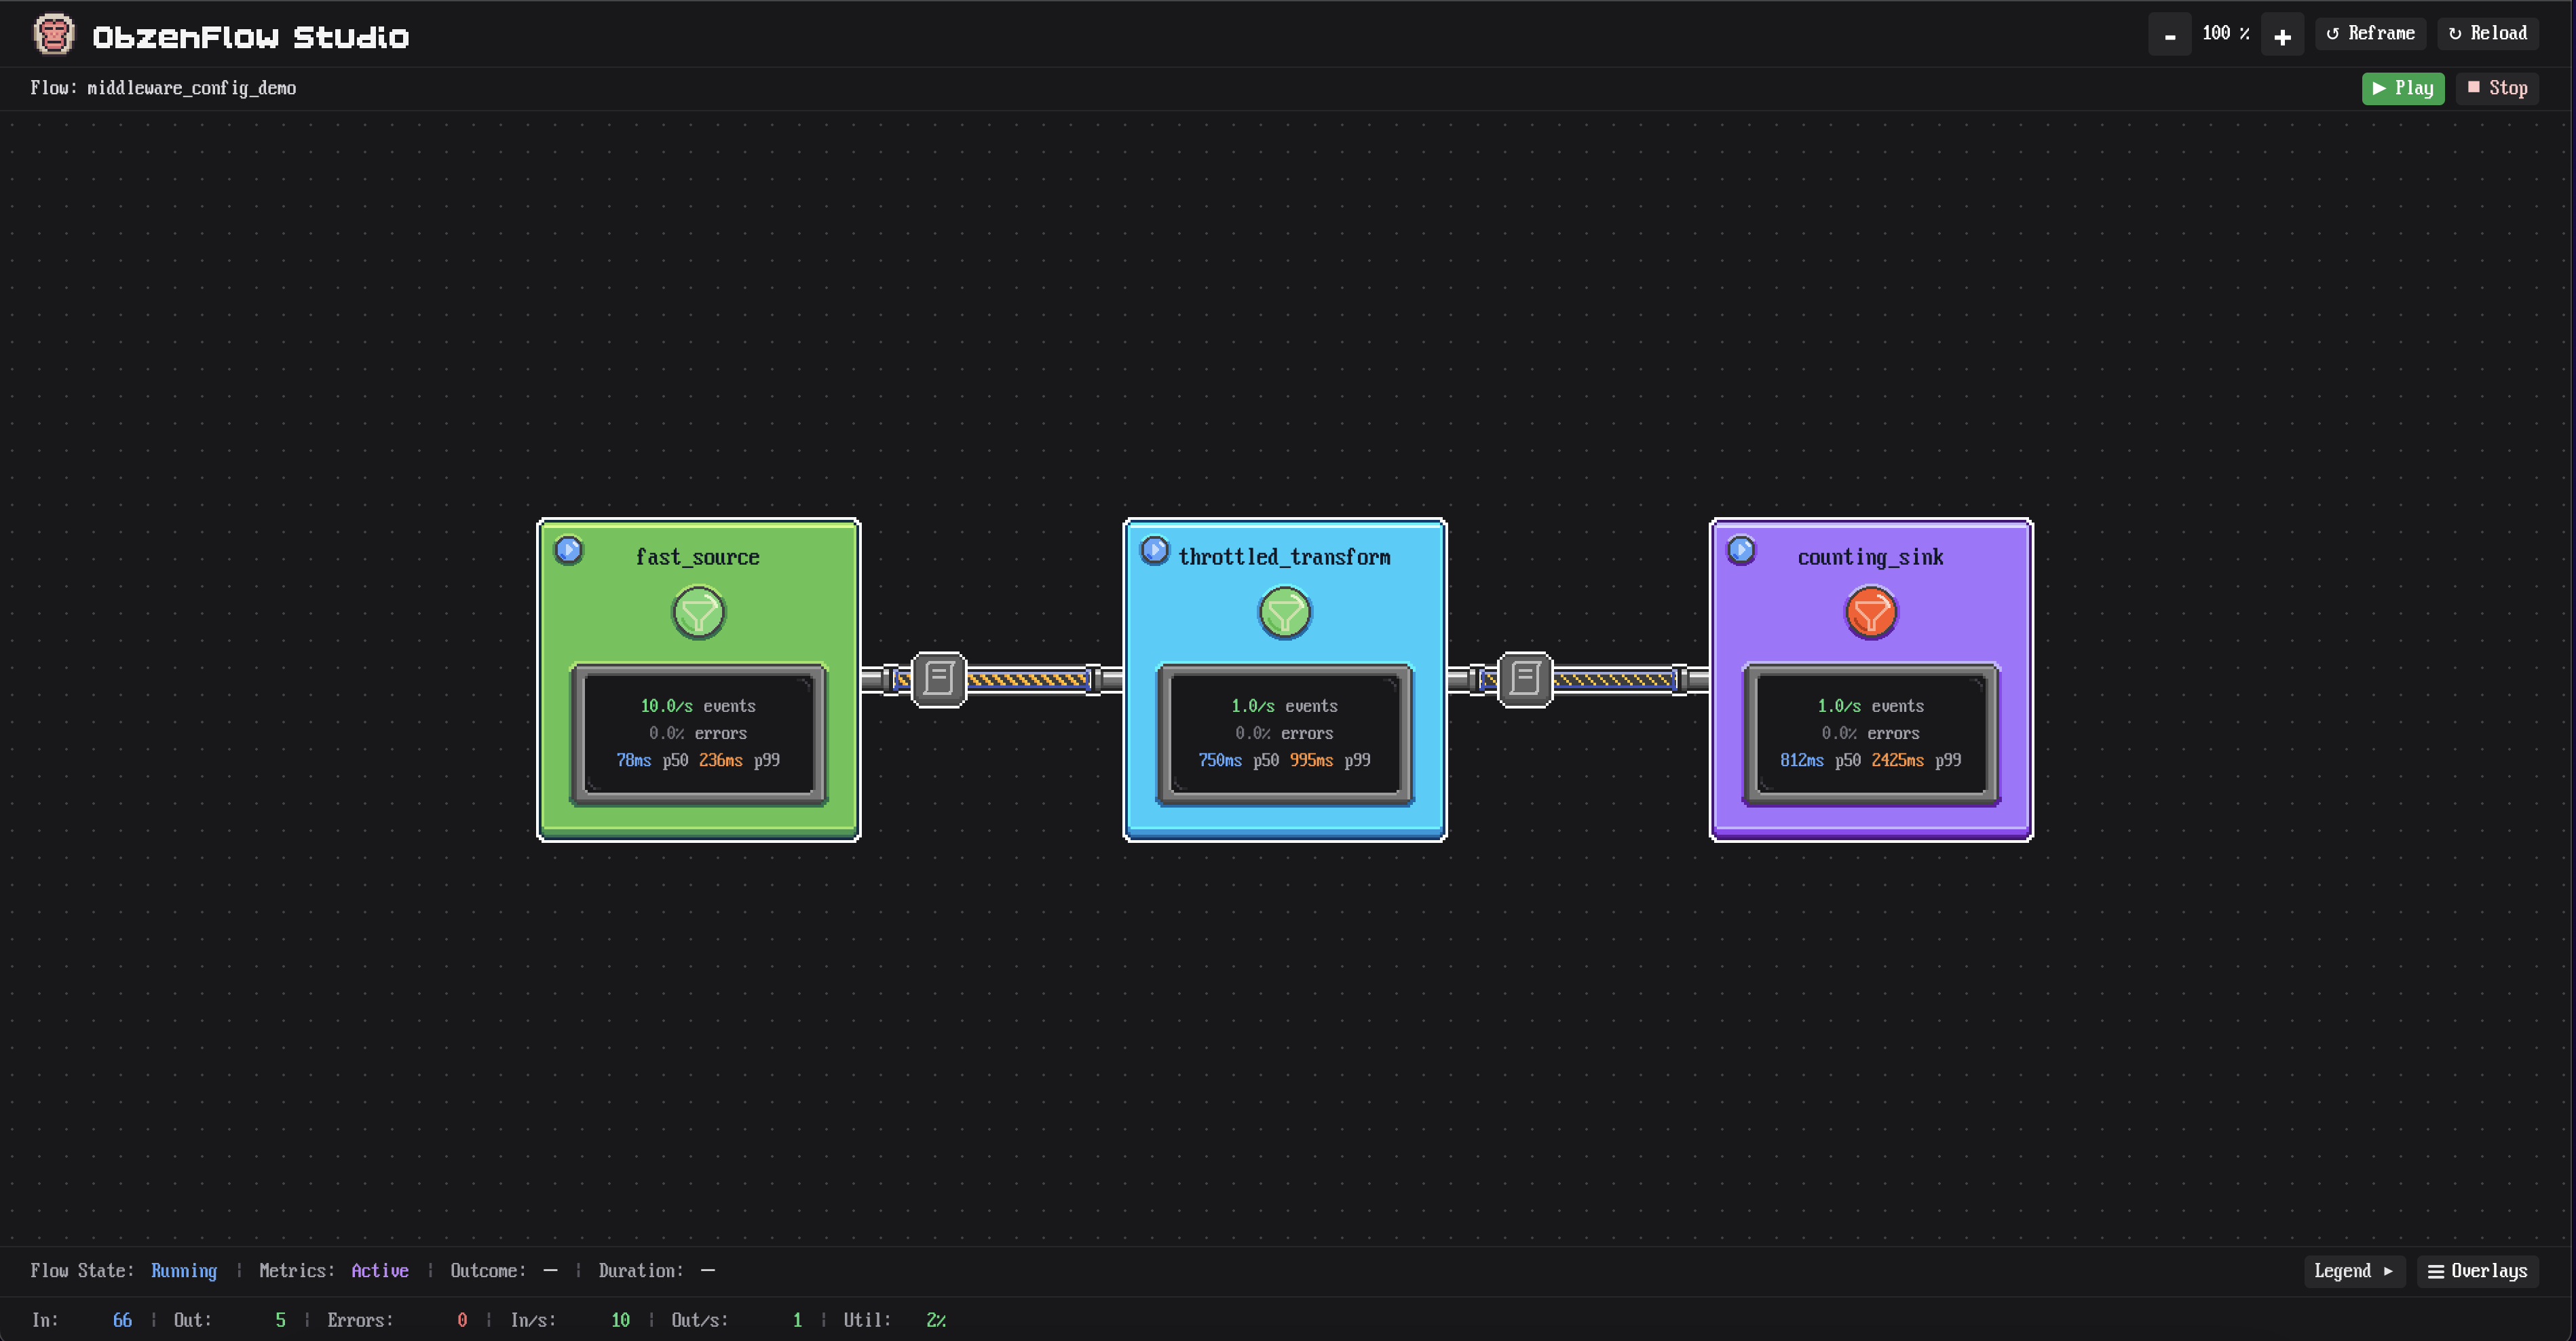
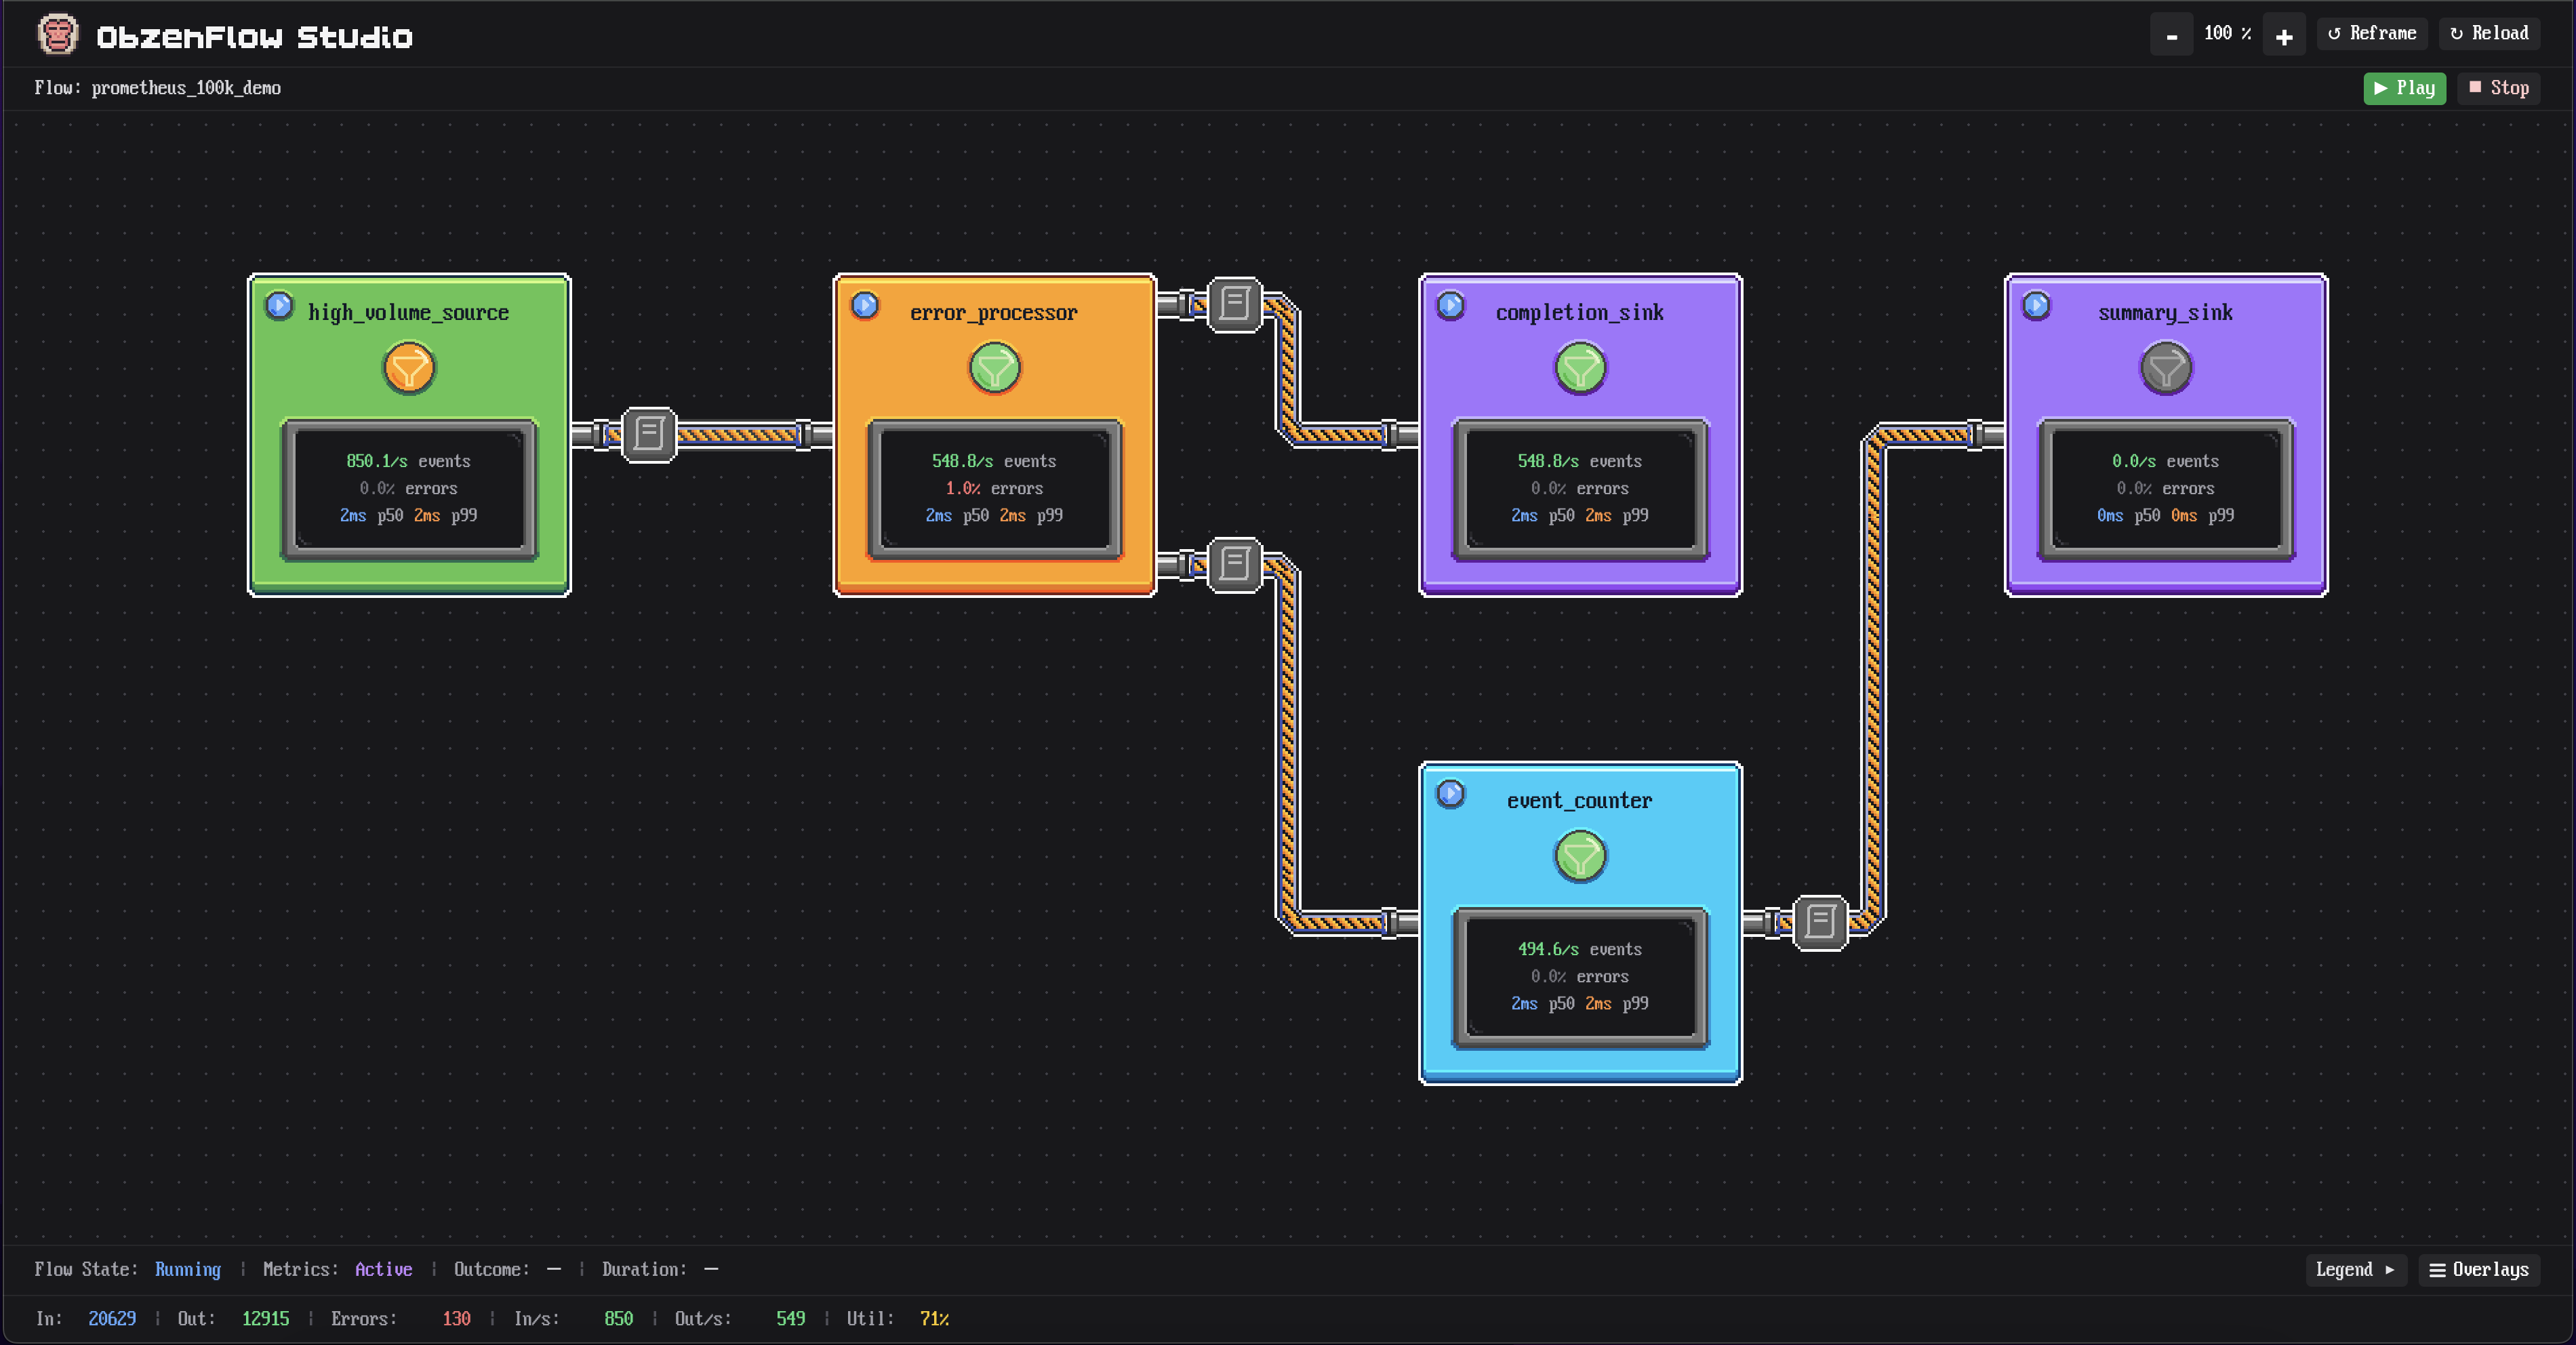
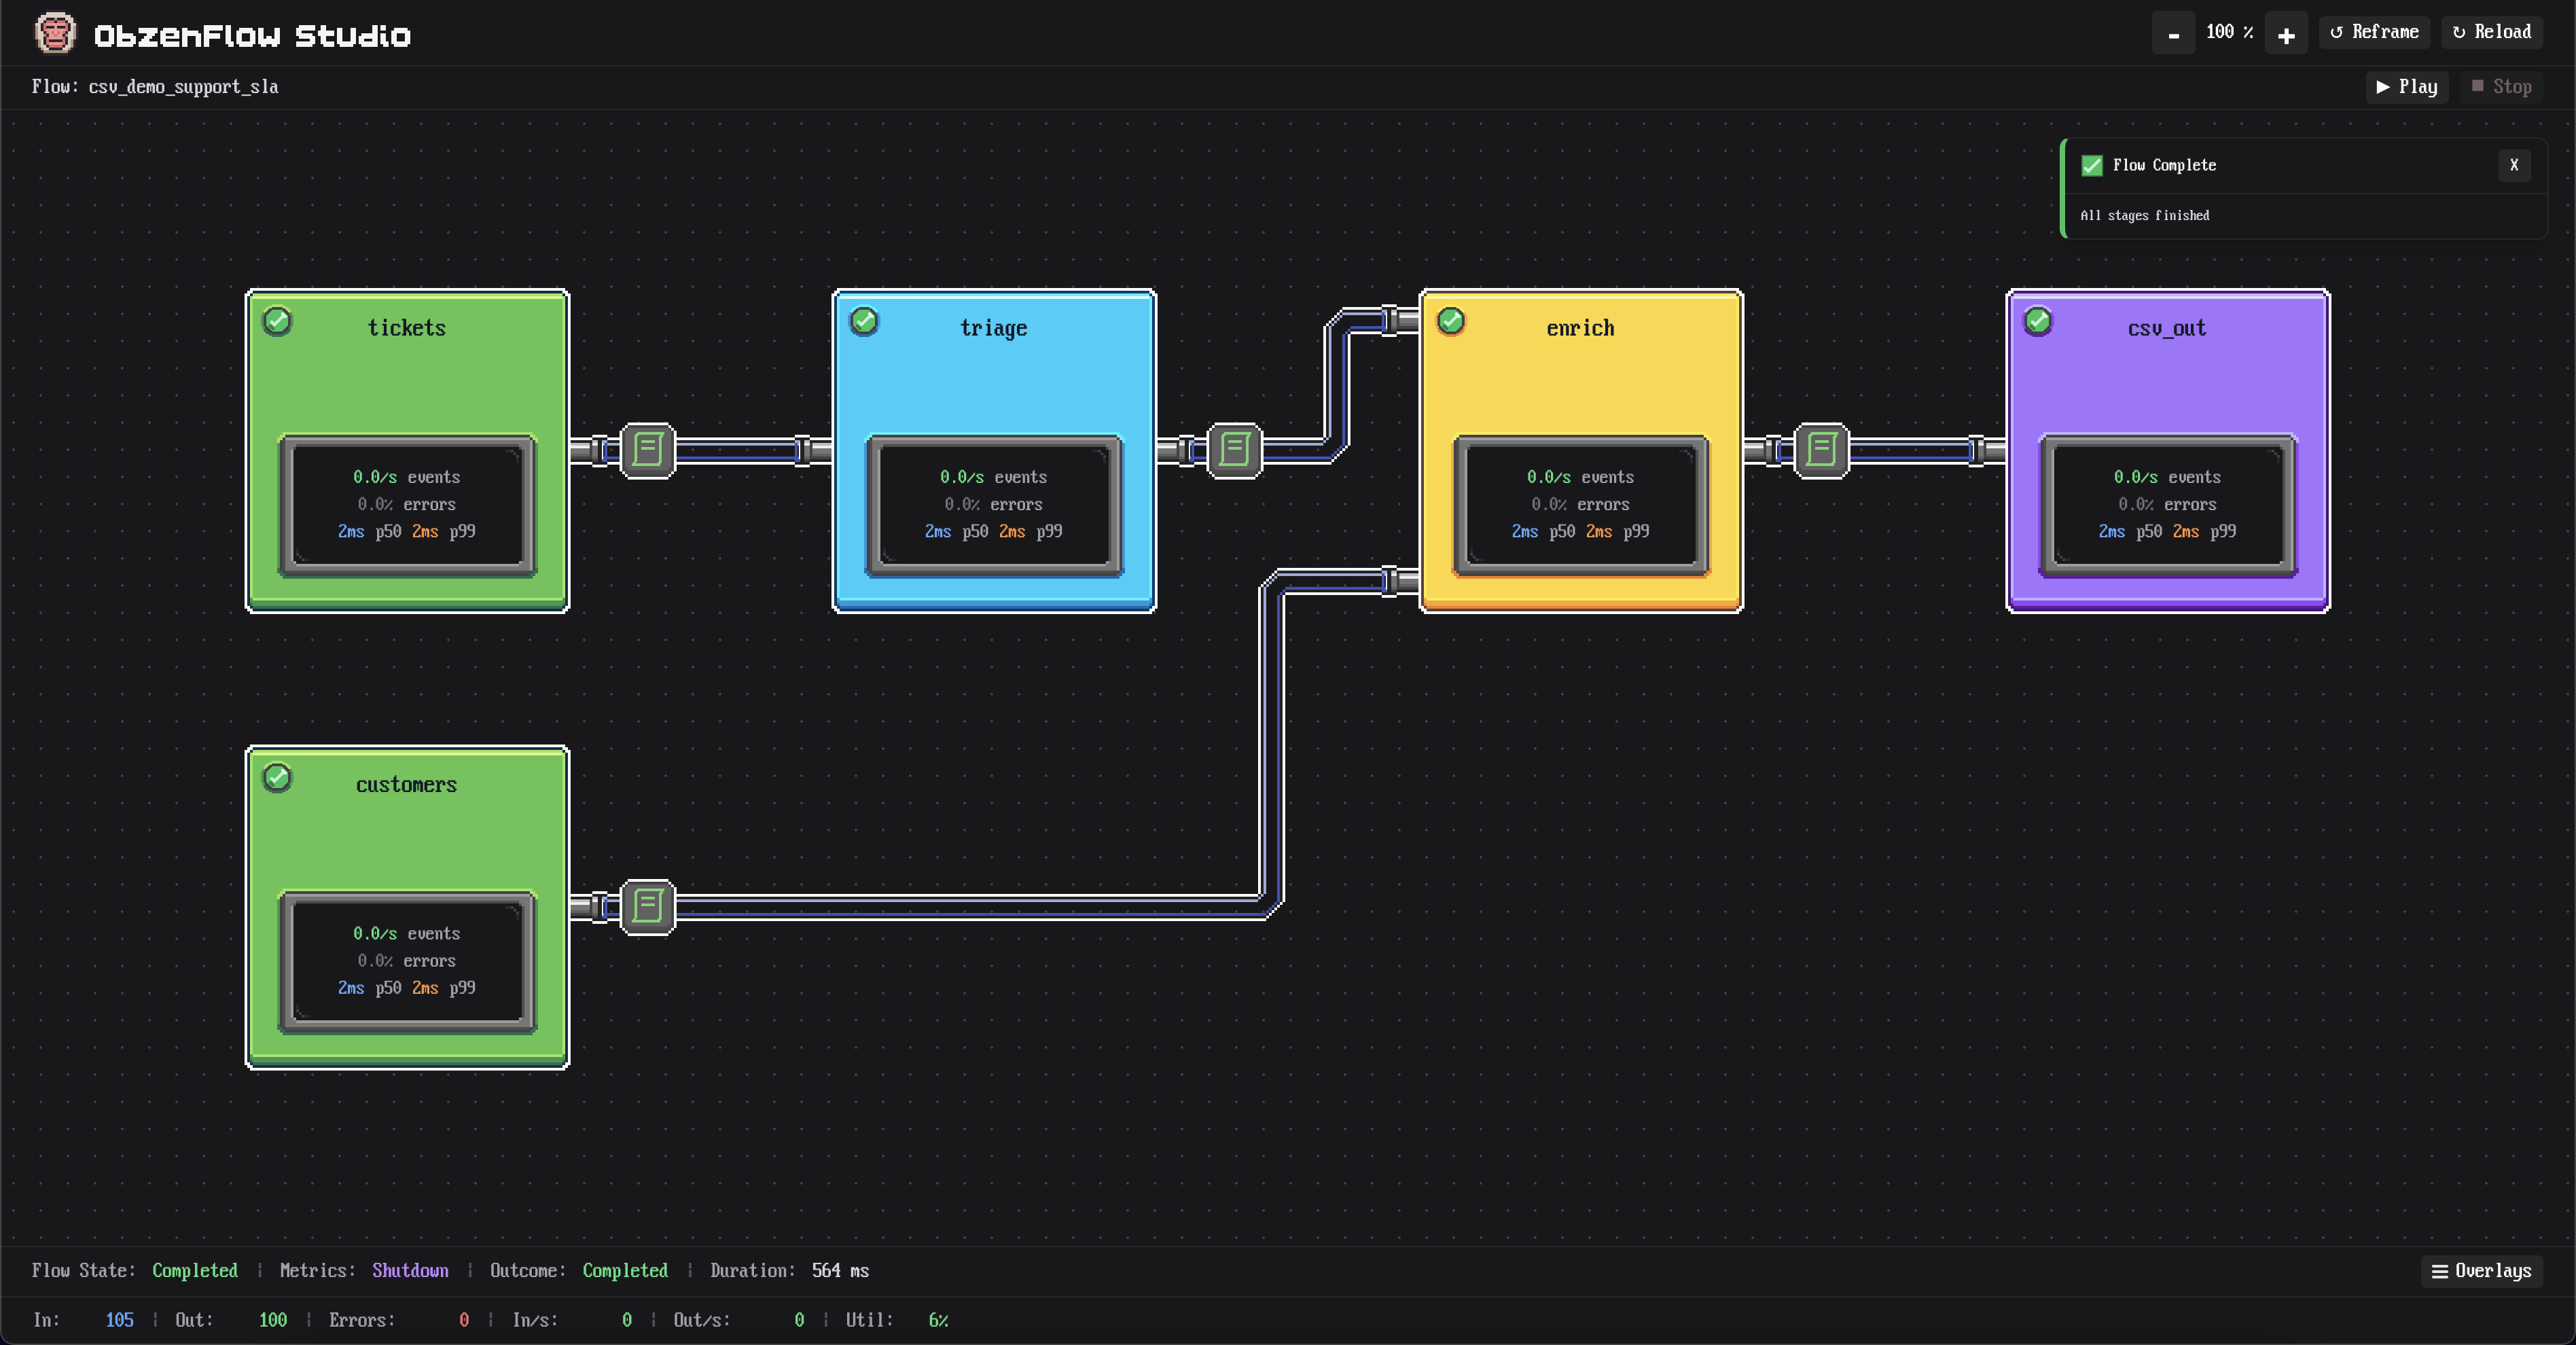
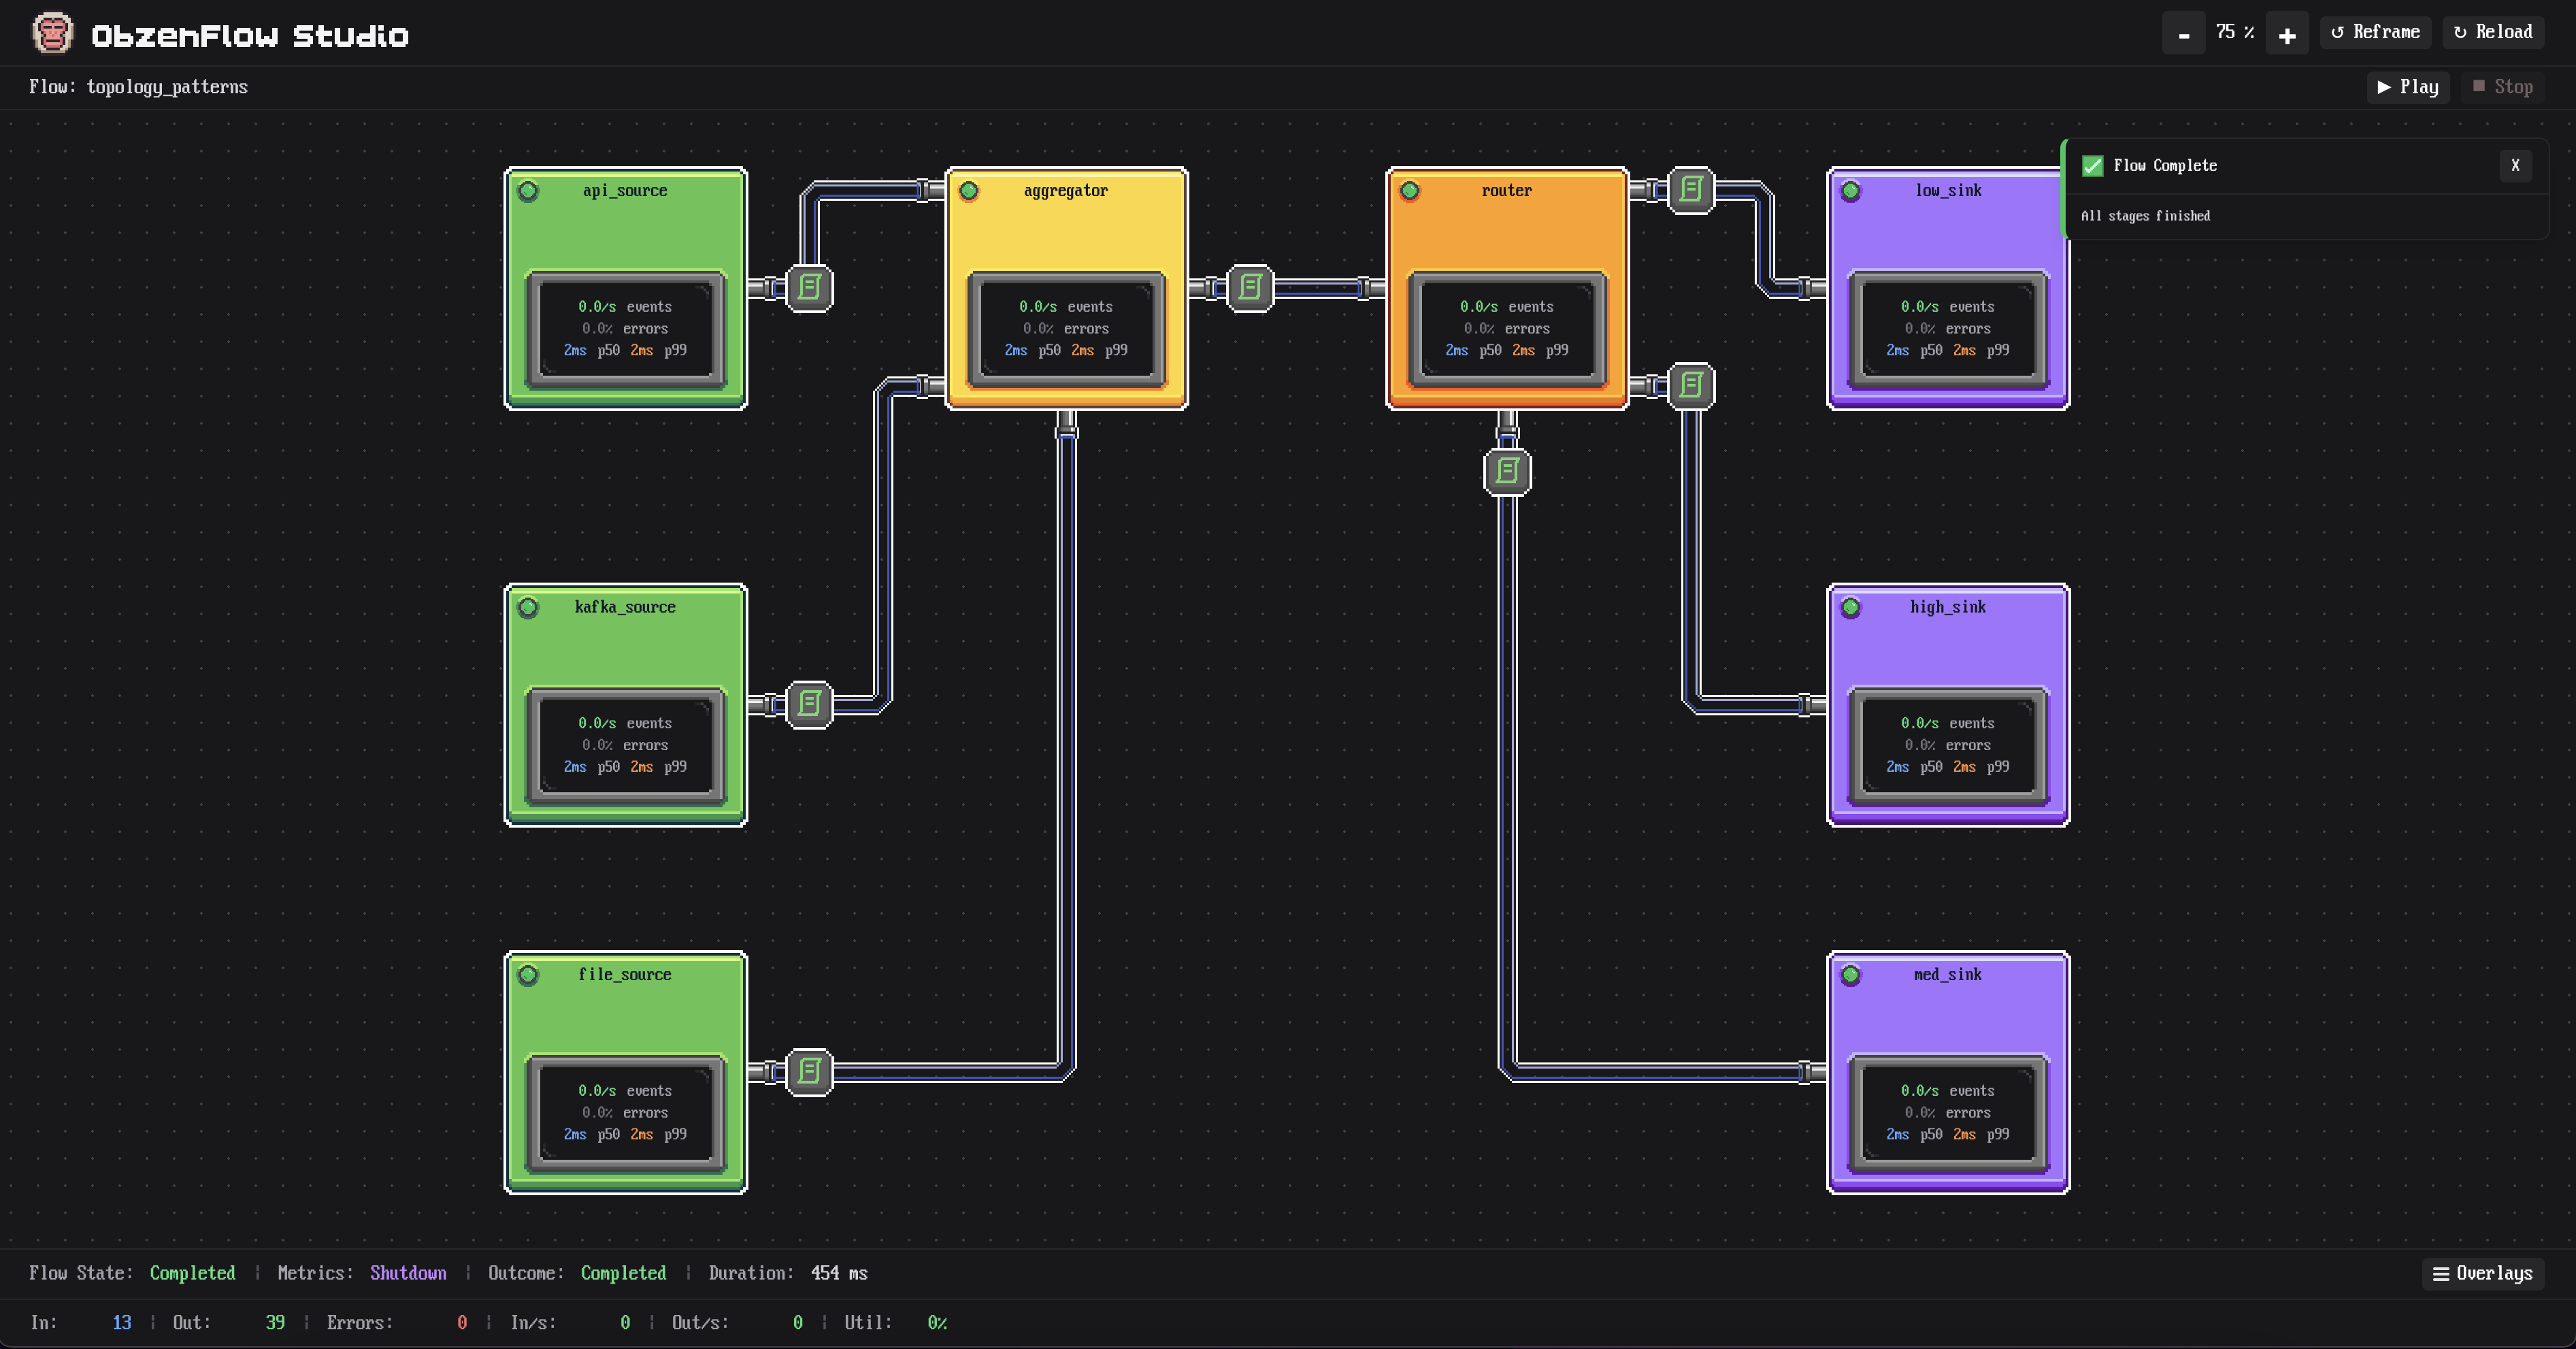
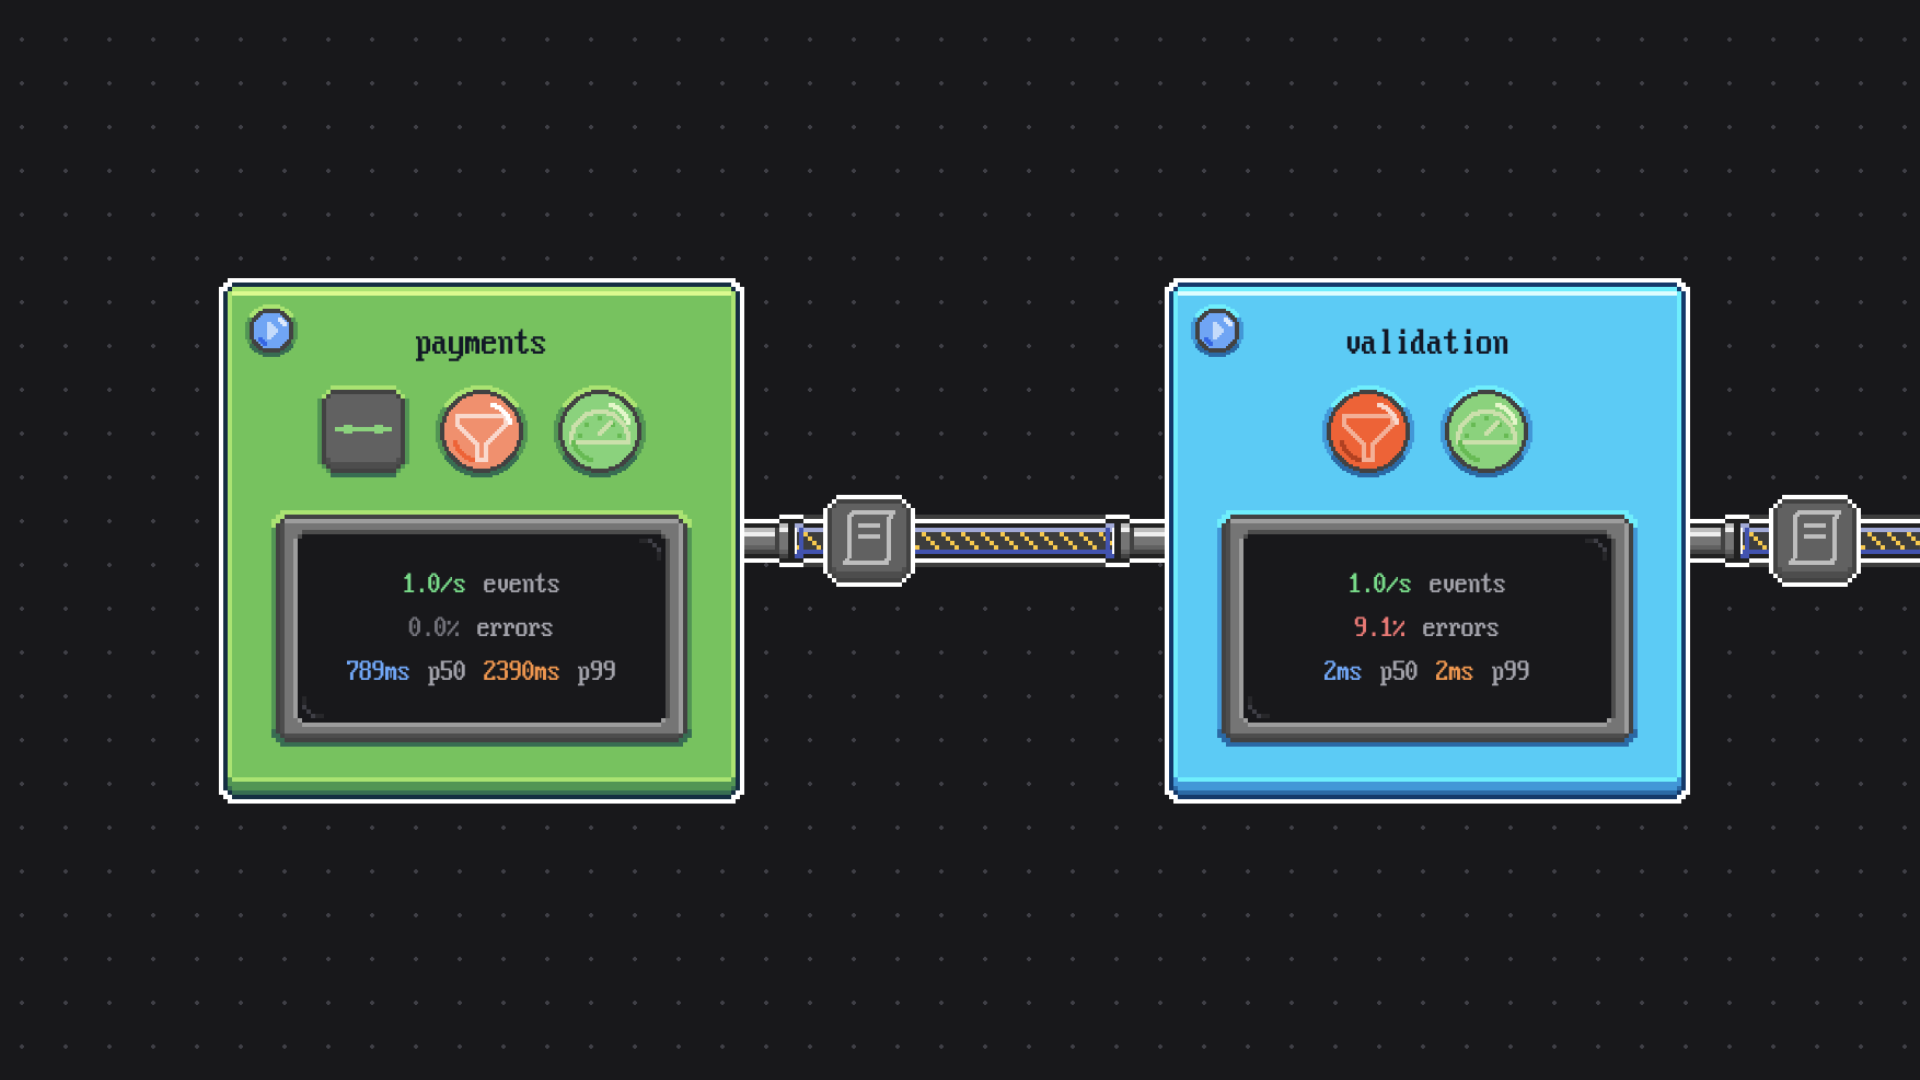
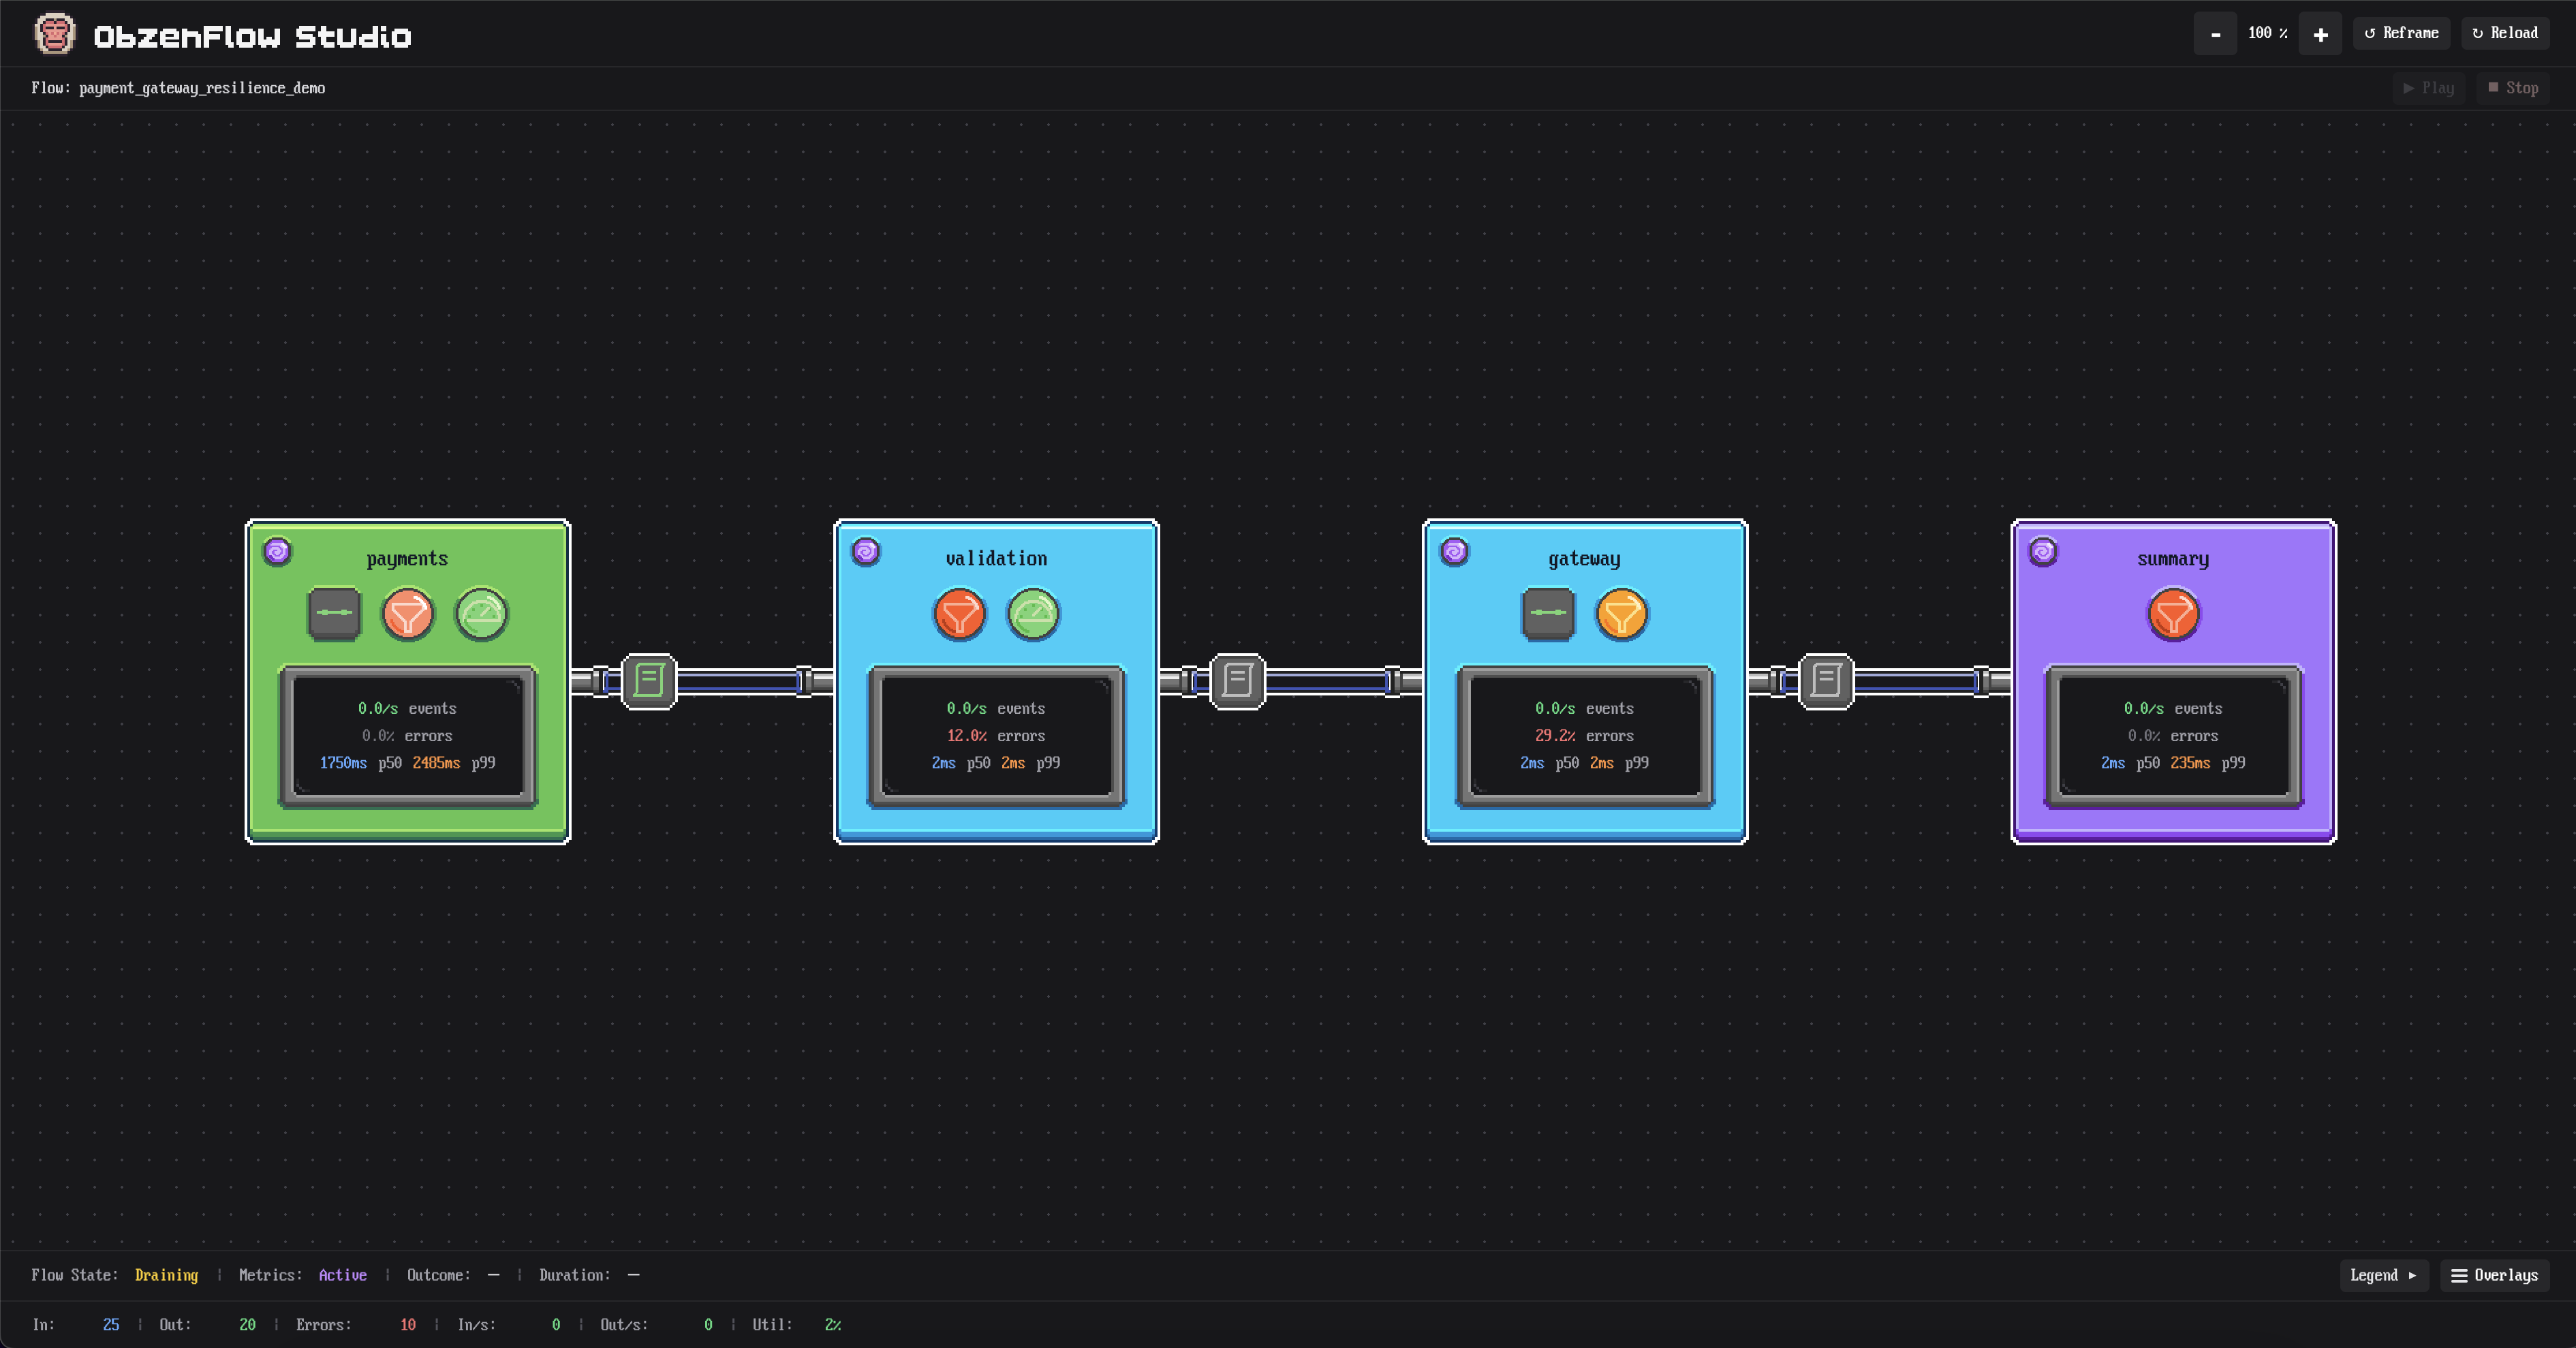
ObzenFlow Studio renders your flow’s topology directly from the running server. Stages appear as colour-coded nodes: green for sources, blue for transforms, purple for sinks, orange for routers, yellow for joins. Connections route around obstacles so dense topologies stay readable. Stages in cycles are marked so feedback loops are visible at a glance.
Four zoom tiers control what level of detail is on screen. Pull back for a bird’s-eye overview of the full graph. Zoom in to see per-stage latency percentiles and middleware state. The layout scales cleanly whether your flow is three stages or a graph with dozens of stages, fan-out, fan-in, and feedback.
No architecture diagram to maintain. No stale Miro board. The topology on screen is the topology that is running.
Where's the bottleneck?
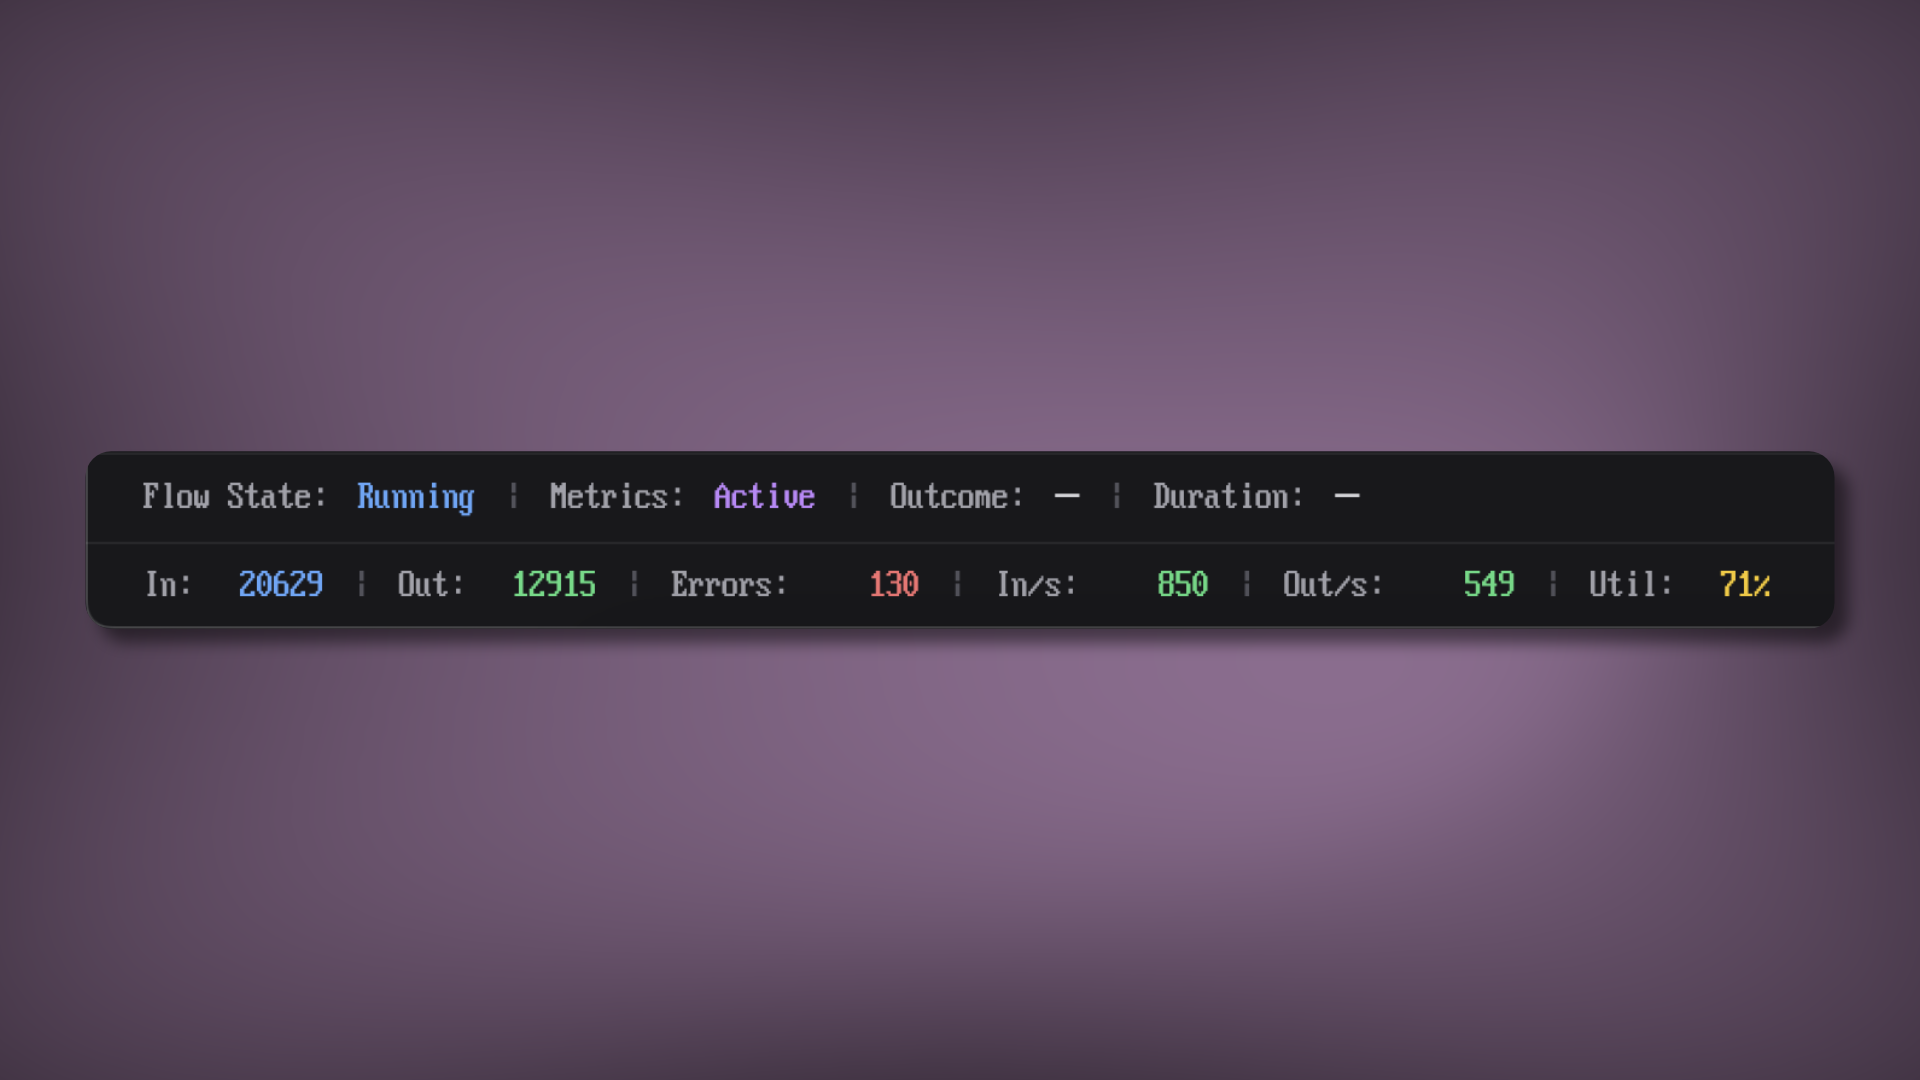
Metrics update every second from the flow’s Prometheus-compatible endpoint. Flow-level numbers appear in a bottom panel: total events in and out, throughput rates, flow utilization, and total errors. Each stage displays its own RED metrics directly on the node: rate (events per second), errors (percentage), and duration (P50 and P99 latency), alongside stage state and middleware status when enabled.
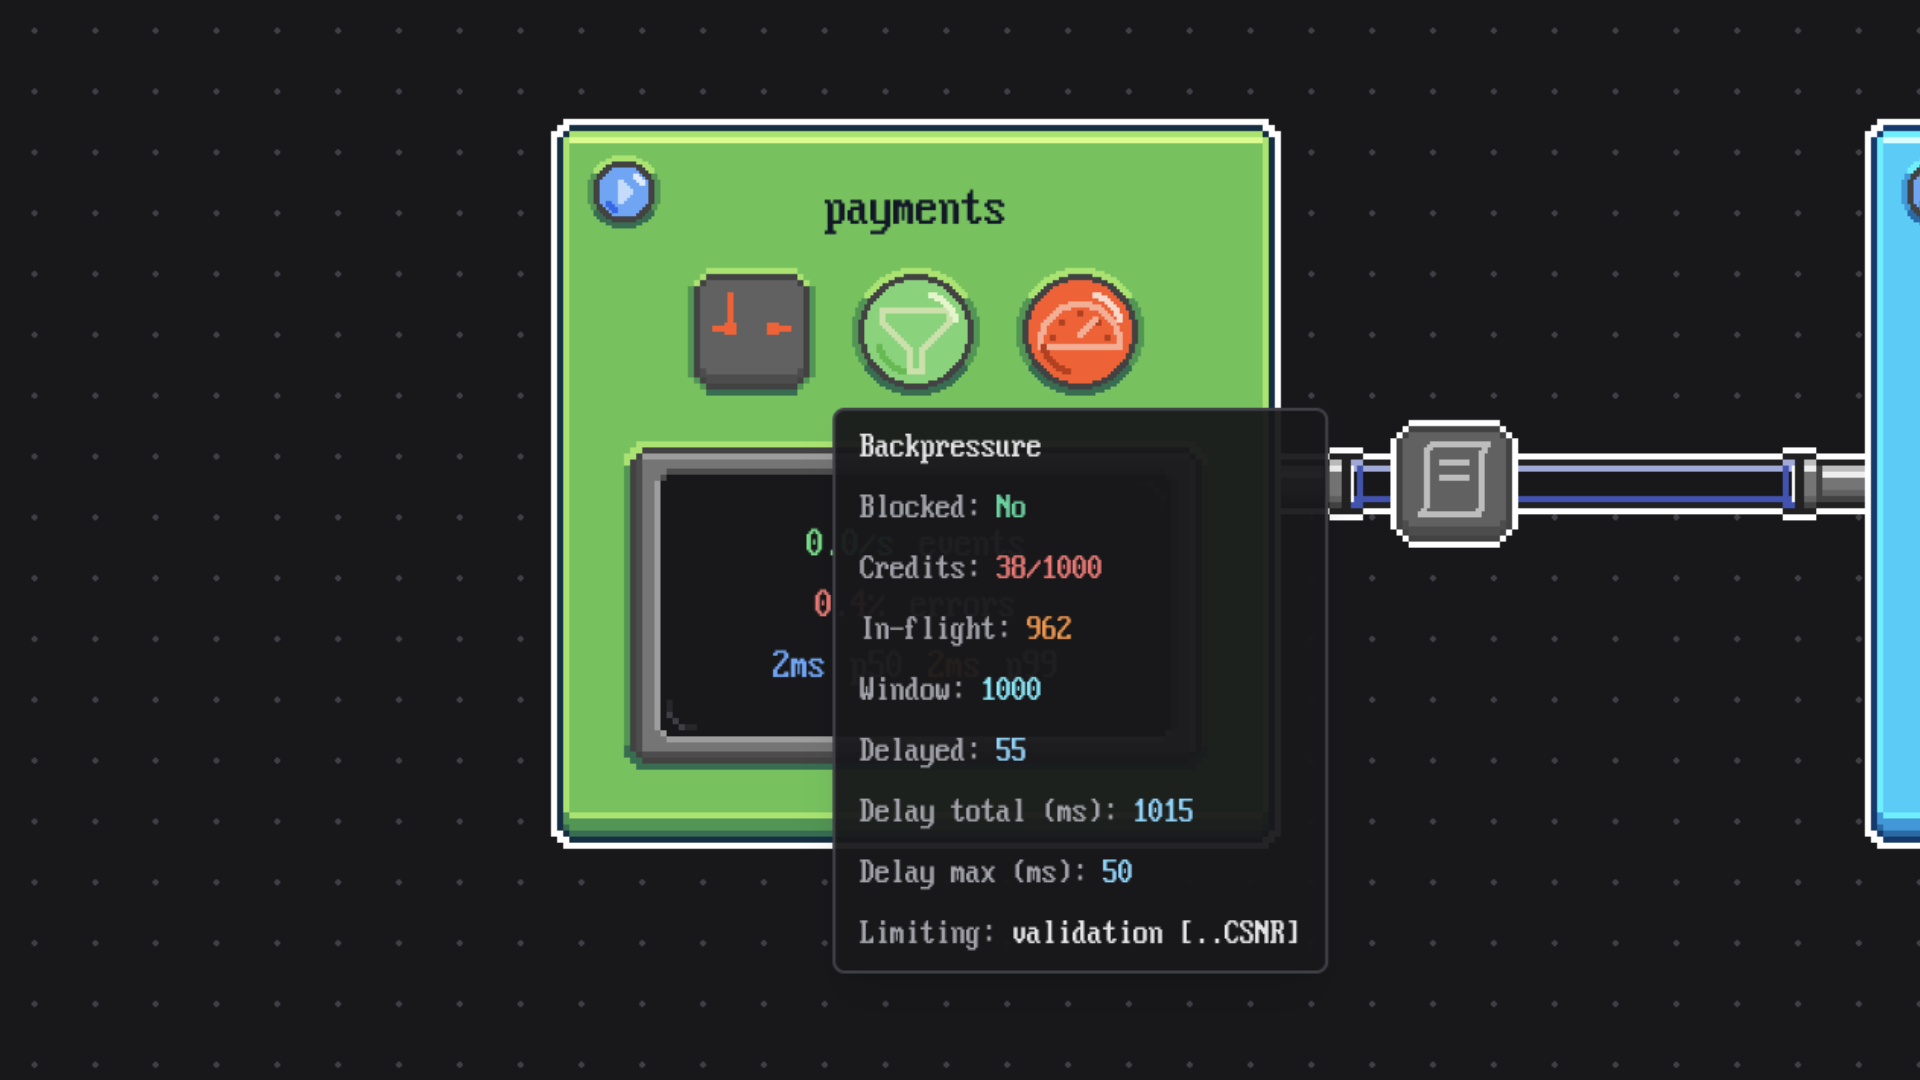
Backpressure is visible on the canvas too. When a stage is blocked, ObzenFlow Studio shows which downstream stage is the bottleneck, the minimum credit level, and the in-flight count at the congested edge. The bottleneck is a visual, not something you infer from a dashboard query.
What broke, and when?
Circuit breakers and rate limiters are visible directly on the stage they protect. Circuit breakers show their current state (closed, open, or half-open), rejection rate, consecutive failure count, and how long they have been in each state. When a breaker opens, the visual treatment changes immediately. No need to check Prometheus or parse logs to know a dependency is failing.
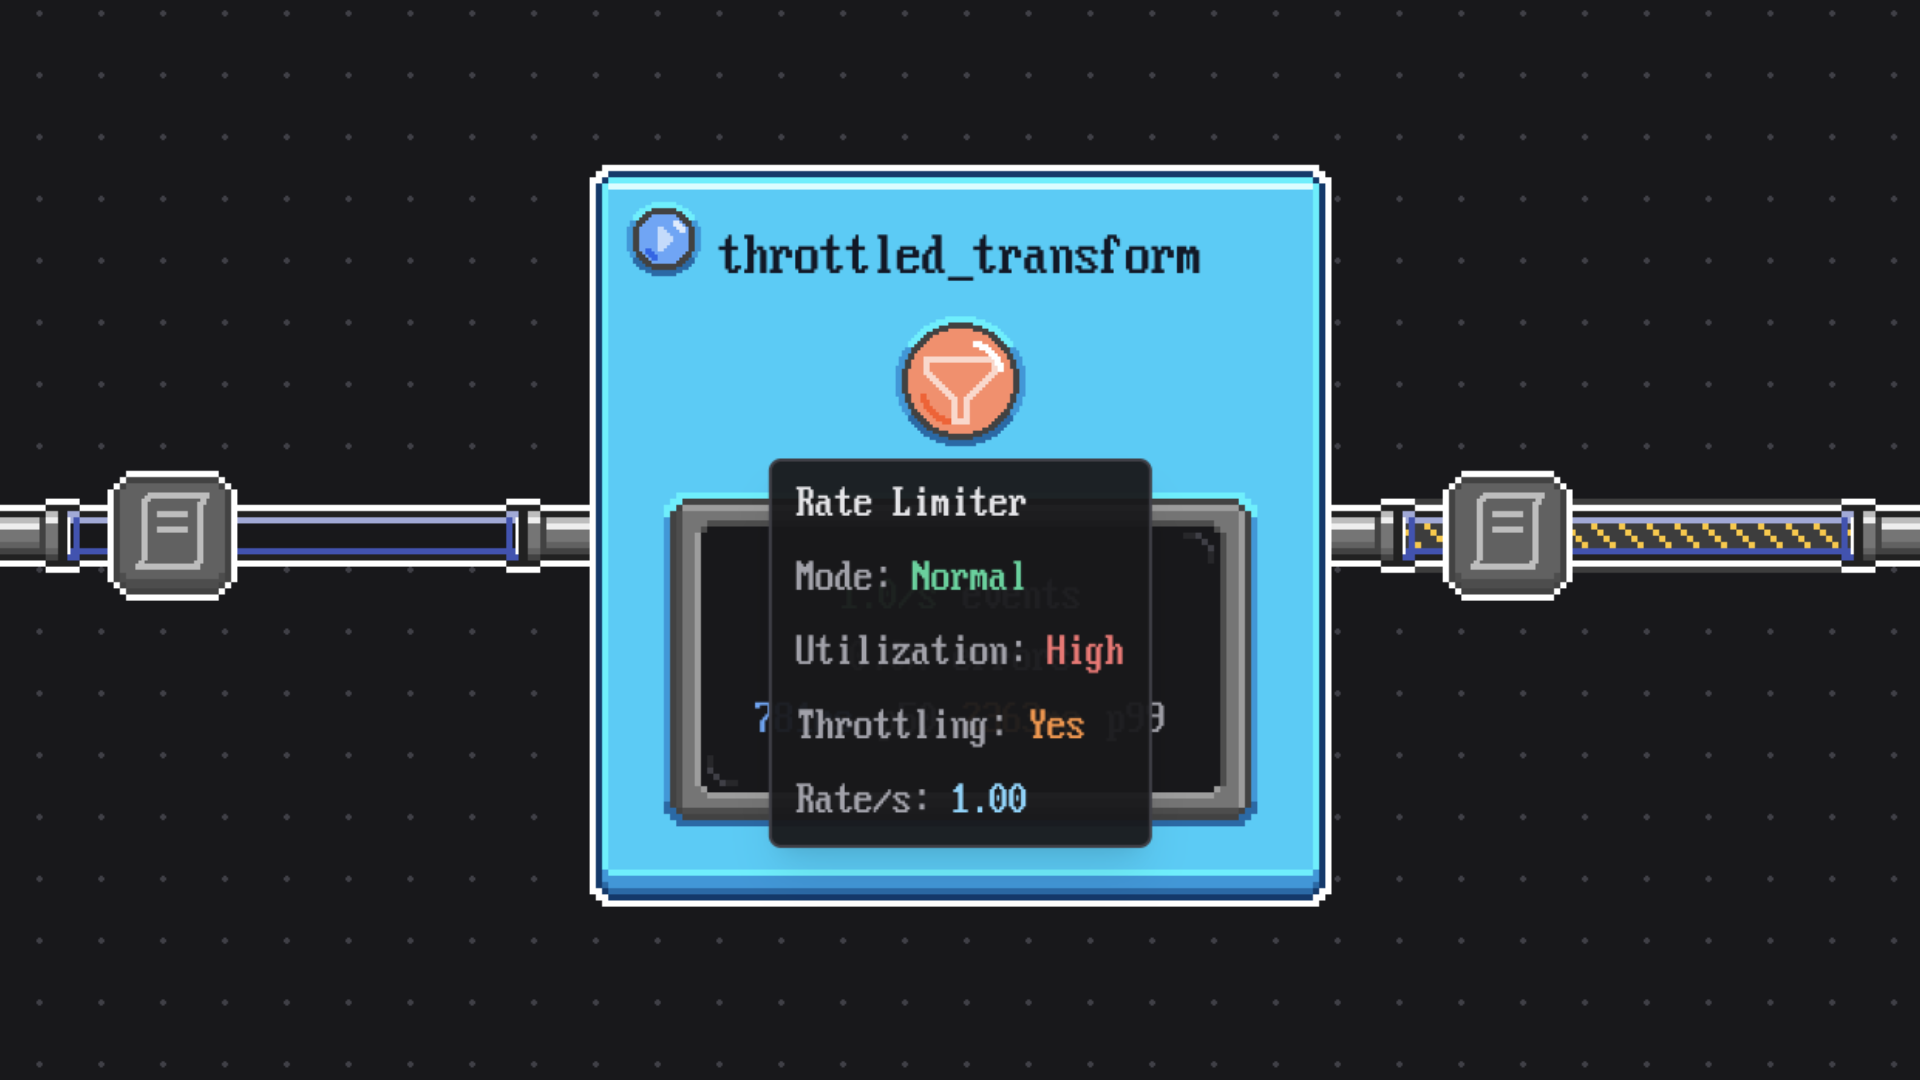
Rate limiters show their current mode, utilization percentage, events in the current window, and how many events have been delayed. Token bucket capacity and current token count are visible. When a limiter begins throttling, the stage pulses to draw attention.
These are the same production-grade primitives you declared in your flow definition. ObzenFlow Studio surfaces their runtime state so you can see them working, not just trust that they are.
Did events actually arrive?
Every connection in the topology displays the contract status for that edge. Passing contracts show a green badge. Violations show red. Overrides show orange. Pending shows grey. The evidence is continuous, not something you query after the fact. A delivery violation is visible the moment it happens, at the exact point in the topology where it occurred.
Select an edge and ObzenFlow Studio reveals the full evidence: result counts, violation counts, override counts, and the specific reasons when violations occur, whether that is a sequence divergence, a timestamp misalignment, or a lag event.
Most runtimes treat delivery guarantees as a configuration setting you trust. ObzenFlow Studio turns them into evidence you can watch. The badge on the edge is either green or it is not.
Is the flow running?
ObzenFlow Studio provides direct lifecycle control. Start a flow and stop it gracefully, draining in-flight events before shutdown. The current state is displayed prominently and colour-coded across the full lifecycle: starting, running, draining, completing, drained, completed, cancelled, or failed.
Button states are driven by the actual flow state received from the server, so controls always reflect reality rather than assumed state. When a flow finishes or fails, the duration and final state appear immediately.
How does ObzenFlow Studio connect?
ObzenFlow Studio is compiled to WebAssembly from the same Rust codebase as the framework. Building ObzenFlow from source includes the visual tooling with no additional runtime dependencies. No Electron app. No separate install. No SaaS dashboard to configure.
Enable the server in your flow’s config and it exposes topology, metrics, and event streams. Launch the ObzenFlow Studio UI and it connects to those endpoints automatically. The topology loads, stages appear on the canvas, and connections are drawn. From that moment, every state change, every metric update, and every middleware event streams to the UI as it happens.
What changes for your team
- Runtime concepts become visible
Watch events move through the topology, see rate limiters begin throttling, and observe circuit breakers open and recover on the canvas.
- Incidents get more direct
Instead of querying metrics, correlating timestamps, or asking what the topology looks like, the current state is visible where the problem is happening.
- Onboarding gets easier
A whiteboard sketch becomes a running demonstration, so teams can learn backpressure, circuit breaking, and delivery contracts from the live system.
Start building today.
ObzenFlow Studio is in development and not yet released. Until then, learn exactly how to build ObzenFlow applications.